Immigrants from Middle Africa vs Ute Associate's Degree
COMPARE
Immigrants from Middle Africa
Ute
Associate's Degree
Associate's Degree Comparison
Immigrants from Middle Africa
Ute
44.7%
ASSOCIATE'S DEGREE
12.7/ 100
METRIC RATING
214th/ 347
METRIC RANK
38.6%
ASSOCIATE'S DEGREE
0.0/ 100
METRIC RATING
299th/ 347
METRIC RANK
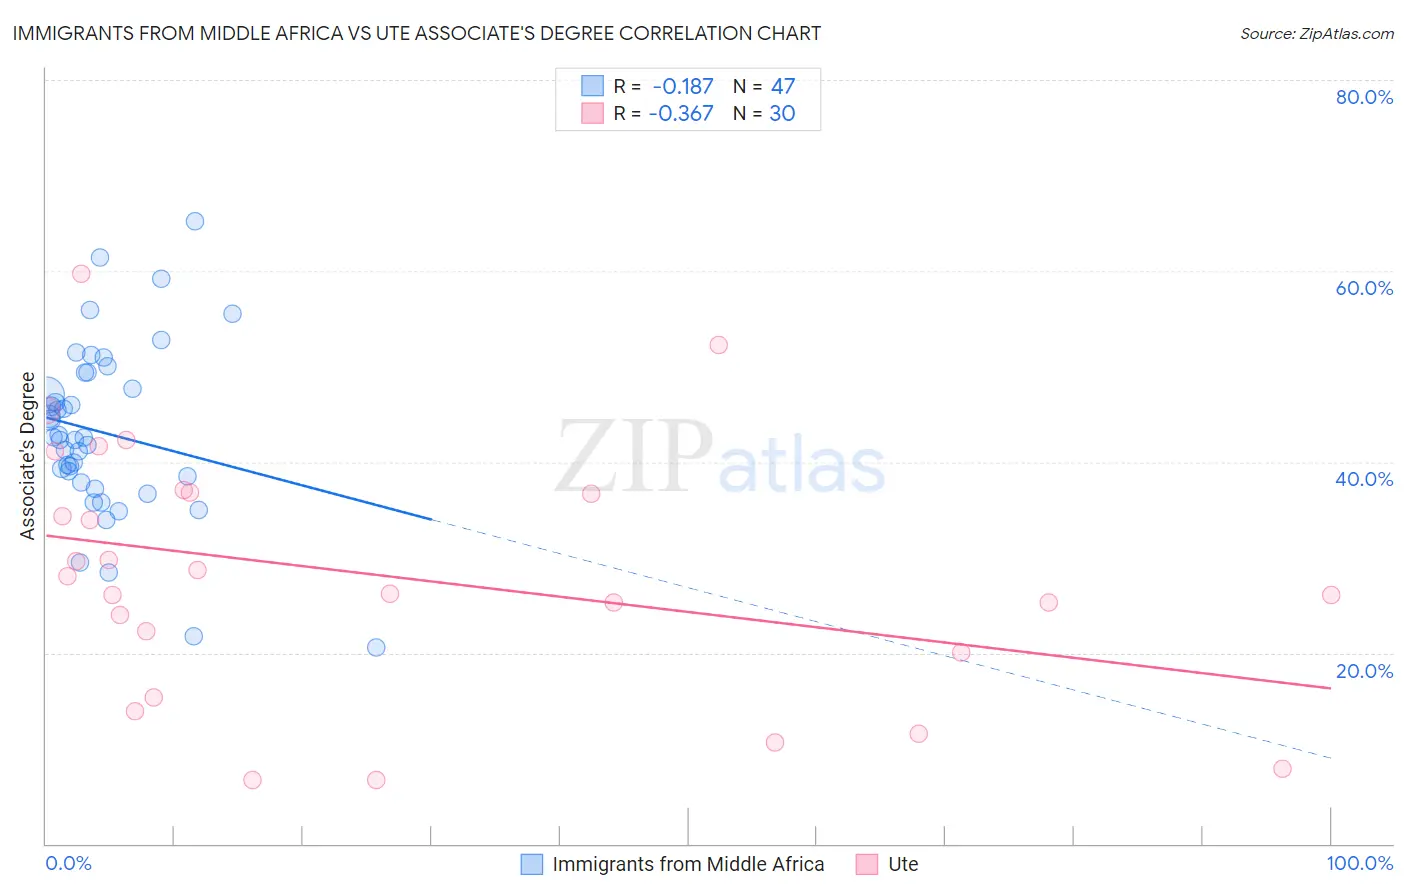
Immigrants from Middle Africa vs Ute Associate's Degree Correlation Chart
The statistical analysis conducted on geographies consisting of 202,743,953 people shows a poor negative correlation between the proportion of Immigrants from Middle Africa and percentage of population with at least associate's degree education in the United States with a correlation coefficient (R) of -0.187 and weighted average of 44.7%. Similarly, the statistical analysis conducted on geographies consisting of 55,668,197 people shows a mild negative correlation between the proportion of Ute and percentage of population with at least associate's degree education in the United States with a correlation coefficient (R) of -0.367 and weighted average of 38.6%, a difference of 15.7%.
Associate's Degree Correlation Summary
| Measurement | Immigrants from Middle Africa | Ute |
| Minimum | 20.5% | 6.7% |
| Maximum | 65.2% | 59.8% |
| Range | 44.7% | 53.1% |
| Mean | 43.1% | 28.2% |
| Median | 42.6% | 27.1% |
| Interquartile 25% (IQ1) | 37.8% | 20.0% |
| Interquartile 75% (IQ3) | 49.3% | 36.8% |
| Interquartile Range (IQR) | 11.5% | 16.8% |
| Standard Deviation (Sample) | 9.1% | 13.3% |
| Standard Deviation (Population) | 9.0% | 13.1% |
Similar Demographics by Associate's Degree
Demographics Similar to Immigrants from Middle Africa by Associate's Degree
In terms of associate's degree, the demographic groups most similar to Immigrants from Middle Africa are Immigrants from Panama (44.7%, a difference of 0.060%), Immigrants from Nigeria (44.6%, a difference of 0.24%), Immigrants from Ghana (44.8%, a difference of 0.25%), French Canadian (44.9%, a difference of 0.38%), and Immigrants (44.5%, a difference of 0.42%).
| Demographics | Rating | Rank | Associate's Degree |
| Panamanians | 18.4 /100 | #207 | Poor 45.1% |
| Dutch | 17.6 /100 | #208 | Poor 45.0% |
| Immigrants | Costa Rica | 16.7 /100 | #209 | Poor 45.0% |
| Immigrants | Philippines | 16.7 /100 | #210 | Poor 45.0% |
| Immigrants | Zaire | 16.6 /100 | #211 | Poor 45.0% |
| French Canadians | 15.0 /100 | #212 | Poor 44.9% |
| Immigrants | Ghana | 14.2 /100 | #213 | Poor 44.8% |
| Immigrants | Middle Africa | 12.7 /100 | #214 | Poor 44.7% |
| Immigrants | Panama | 12.4 /100 | #215 | Poor 44.7% |
| Immigrants | Nigeria | 11.4 /100 | #216 | Poor 44.6% |
| Immigrants | Immigrants | 10.5 /100 | #217 | Poor 44.5% |
| Spanish | 9.4 /100 | #218 | Tragic 44.4% |
| Whites/Caucasians | 7.5 /100 | #219 | Tragic 44.2% |
| Portuguese | 7.2 /100 | #220 | Tragic 44.1% |
| Immigrants | Western Africa | 6.6 /100 | #221 | Tragic 44.1% |
Demographics Similar to Ute by Associate's Degree
In terms of associate's degree, the demographic groups most similar to Ute are Chickasaw (38.6%, a difference of 0.040%), Cheyenne (38.7%, a difference of 0.090%), Tsimshian (38.6%, a difference of 0.090%), Colville (38.5%, a difference of 0.24%), and Guatemalan (38.5%, a difference of 0.33%).
| Demographics | Rating | Rank | Associate's Degree |
| Blacks/African Americans | 0.0 /100 | #292 | Tragic 39.1% |
| Nepalese | 0.0 /100 | #293 | Tragic 39.0% |
| Salvadorans | 0.0 /100 | #294 | Tragic 39.0% |
| Hondurans | 0.0 /100 | #295 | Tragic 38.9% |
| Cherokee | 0.0 /100 | #296 | Tragic 38.9% |
| Cape Verdeans | 0.0 /100 | #297 | Tragic 38.8% |
| Cheyenne | 0.0 /100 | #298 | Tragic 38.7% |
| Ute | 0.0 /100 | #299 | Tragic 38.6% |
| Chickasaw | 0.0 /100 | #300 | Tragic 38.6% |
| Tsimshian | 0.0 /100 | #301 | Tragic 38.6% |
| Colville | 0.0 /100 | #302 | Tragic 38.5% |
| Guatemalans | 0.0 /100 | #303 | Tragic 38.5% |
| Sioux | 0.0 /100 | #304 | Tragic 38.5% |
| Immigrants | Honduras | 0.0 /100 | #305 | Tragic 38.5% |
| Shoshone | 0.0 /100 | #306 | Tragic 38.4% |