Immigrants from Taiwan vs Okinawan No Schooling Completed
COMPARE
Immigrants from Taiwan
Okinawan
No Schooling Completed
No Schooling Completed Comparison
Immigrants from Taiwan
Okinawans
2.1%
NO SCHOOLING COMPLETED
42.6/ 100
METRIC RATING
181st/ 347
METRIC RANK
1.8%
NO SCHOOLING COMPLETED
97.1/ 100
METRIC RATING
108th/ 347
METRIC RANK
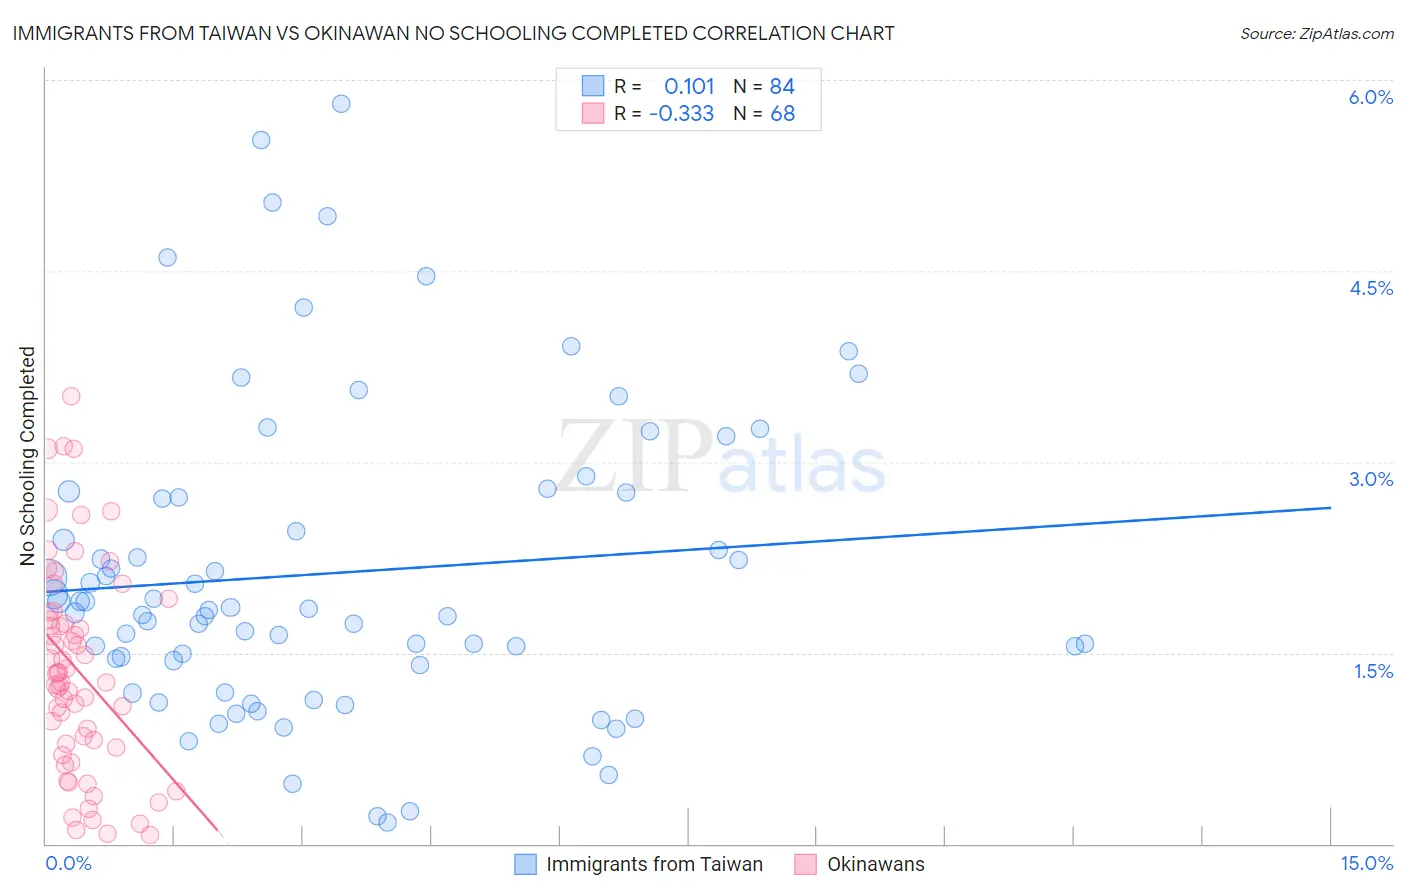
Immigrants from Taiwan vs Okinawan No Schooling Completed Correlation Chart
The statistical analysis conducted on geographies consisting of 295,749,298 people shows a poor positive correlation between the proportion of Immigrants from Taiwan and percentage of population with no schooling in the United States with a correlation coefficient (R) of 0.101 and weighted average of 2.1%. Similarly, the statistical analysis conducted on geographies consisting of 73,597,304 people shows a mild negative correlation between the proportion of Okinawans and percentage of population with no schooling in the United States with a correlation coefficient (R) of -0.333 and weighted average of 1.8%, a difference of 14.4%.
No Schooling Completed Correlation Summary
| Measurement | Immigrants from Taiwan | Okinawan |
| Minimum | 0.16% | 0.067% |
| Maximum | 5.8% | 3.5% |
| Range | 5.7% | 3.5% |
| Mean | 2.1% | 1.4% |
| Median | 1.8% | 1.3% |
| Interquartile 25% (IQ1) | 1.4% | 0.77% |
| Interquartile 75% (IQ3) | 2.7% | 1.8% |
| Interquartile Range (IQR) | 1.3% | 1.0% |
| Standard Deviation (Sample) | 1.2% | 0.81% |
| Standard Deviation (Population) | 1.2% | 0.80% |
Similar Demographics by No Schooling Completed
Demographics Similar to Immigrants from Taiwan by No Schooling Completed
In terms of no schooling completed, the demographic groups most similar to Immigrants from Taiwan are French American Indian (2.1%, a difference of 0.050%), Black/African American (2.1%, a difference of 0.15%), Pima (2.1%, a difference of 0.17%), Portuguese (2.1%, a difference of 0.18%), and Immigrants from Kazakhstan (2.1%, a difference of 0.24%).
| Demographics | Rating | Rank | No Schooling Completed |
| Immigrants | Micronesia | 50.0 /100 | #174 | Average 2.1% |
| Arabs | 46.4 /100 | #175 | Average 2.1% |
| Panamanians | 45.2 /100 | #176 | Average 2.1% |
| Arapaho | 45.0 /100 | #177 | Average 2.1% |
| Pakistanis | 44.7 /100 | #178 | Average 2.1% |
| Immigrants | Kazakhstan | 44.3 /100 | #179 | Average 2.1% |
| Portuguese | 43.9 /100 | #180 | Average 2.1% |
| Immigrants | Taiwan | 42.6 /100 | #181 | Average 2.1% |
| French American Indians | 42.2 /100 | #182 | Average 2.1% |
| Blacks/African Americans | 41.4 /100 | #183 | Average 2.1% |
| Pima | 41.3 /100 | #184 | Average 2.1% |
| Mongolians | 40.8 /100 | #185 | Average 2.1% |
| Immigrants | Bosnia and Herzegovina | 38.6 /100 | #186 | Fair 2.1% |
| Navajo | 36.5 /100 | #187 | Fair 2.1% |
| Immigrants | Kenya | 36.2 /100 | #188 | Fair 2.1% |
Demographics Similar to Okinawans by No Schooling Completed
In terms of no schooling completed, the demographic groups most similar to Okinawans are Yugoslavian (1.8%, a difference of 0.22%), Immigrants from France (1.8%, a difference of 0.26%), Immigrants from Saudi Arabia (1.9%, a difference of 0.35%), Immigrants from Latvia (1.9%, a difference of 0.48%), and Immigrants from Japan (1.9%, a difference of 0.63%).
| Demographics | Rating | Rank | No Schooling Completed |
| Immigrants | Czechoslovakia | 97.9 /100 | #101 | Exceptional 1.8% |
| Immigrants | Switzerland | 97.9 /100 | #102 | Exceptional 1.8% |
| Basques | 97.9 /100 | #103 | Exceptional 1.8% |
| Thais | 97.5 /100 | #104 | Exceptional 1.8% |
| German Russians | 97.5 /100 | #105 | Exceptional 1.8% |
| Immigrants | France | 97.3 /100 | #106 | Exceptional 1.8% |
| Yugoslavians | 97.2 /100 | #107 | Exceptional 1.8% |
| Okinawans | 97.1 /100 | #108 | Exceptional 1.8% |
| Immigrants | Saudi Arabia | 96.8 /100 | #109 | Exceptional 1.9% |
| Immigrants | Latvia | 96.7 /100 | #110 | Exceptional 1.9% |
| Immigrants | Japan | 96.6 /100 | #111 | Exceptional 1.9% |
| Pueblo | 96.4 /100 | #112 | Exceptional 1.9% |
| Immigrants | Zimbabwe | 96.2 /100 | #113 | Exceptional 1.9% |
| Immigrants | Norway | 96.1 /100 | #114 | Exceptional 1.9% |
| Syrians | 96.0 /100 | #115 | Exceptional 1.9% |