South African vs Okinawan No Schooling Completed
COMPARE
South African
Okinawan
No Schooling Completed
No Schooling Completed Comparison
South Africans
Okinawans
1.8%
NO SCHOOLING COMPLETED
99.1/ 100
METRIC RATING
89th/ 347
METRIC RANK
1.8%
NO SCHOOLING COMPLETED
97.1/ 100
METRIC RATING
108th/ 347
METRIC RANK
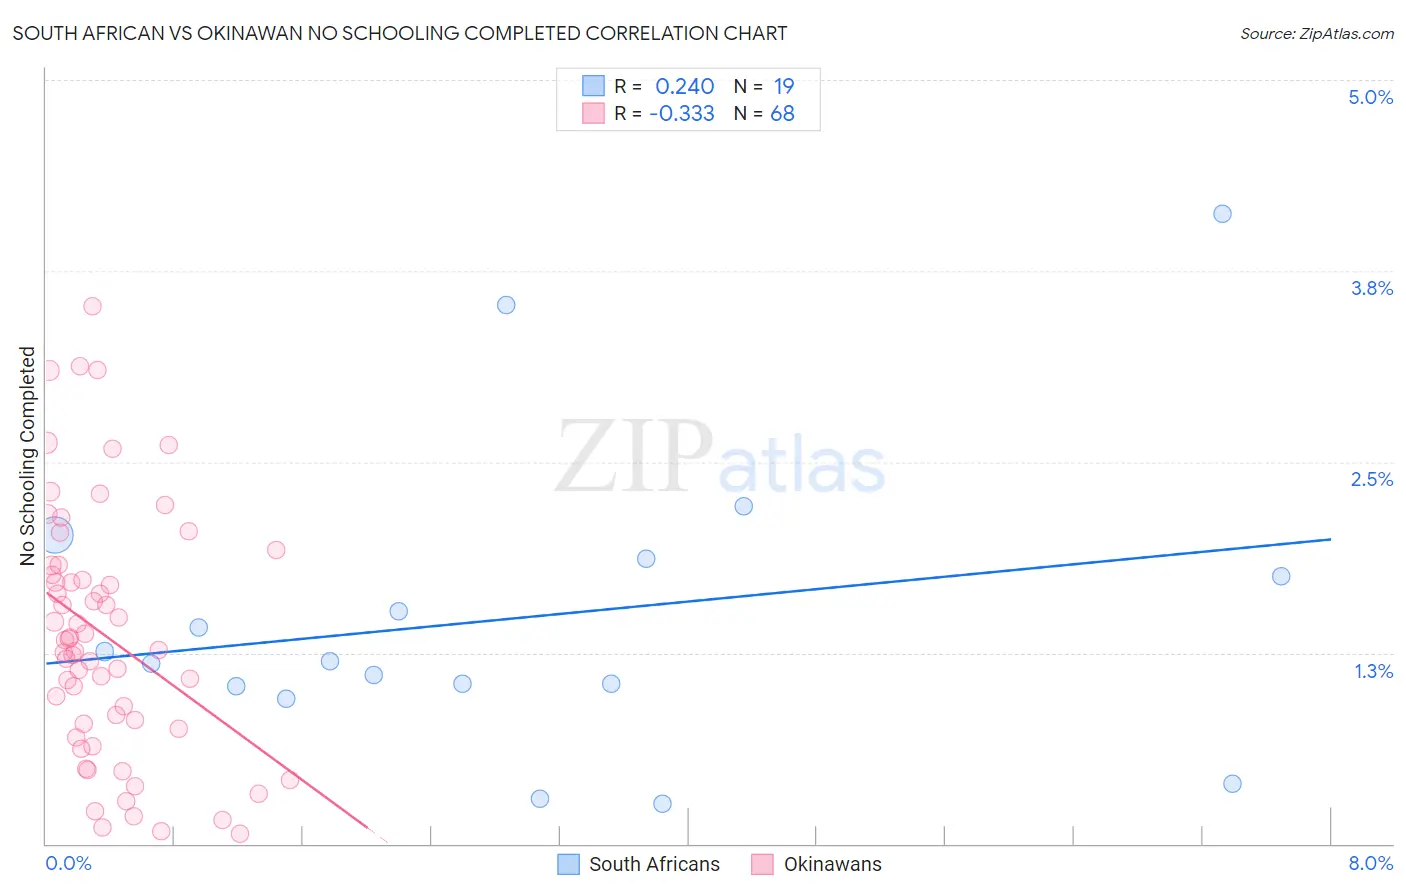
South African vs Okinawan No Schooling Completed Correlation Chart
The statistical analysis conducted on geographies consisting of 181,622,375 people shows a weak positive correlation between the proportion of South Africans and percentage of population with no schooling in the United States with a correlation coefficient (R) of 0.240 and weighted average of 1.8%. Similarly, the statistical analysis conducted on geographies consisting of 73,597,304 people shows a mild negative correlation between the proportion of Okinawans and percentage of population with no schooling in the United States with a correlation coefficient (R) of -0.333 and weighted average of 1.8%, a difference of 5.0%.
No Schooling Completed Correlation Summary
| Measurement | South African | Okinawan |
| Minimum | 0.27% | 0.067% |
| Maximum | 4.1% | 3.5% |
| Range | 3.9% | 3.5% |
| Mean | 1.5% | 1.4% |
| Median | 1.2% | 1.3% |
| Interquartile 25% (IQ1) | 1.0% | 0.77% |
| Interquartile 75% (IQ3) | 1.9% | 1.8% |
| Interquartile Range (IQR) | 0.84% | 1.0% |
| Standard Deviation (Sample) | 0.99% | 0.81% |
| Standard Deviation (Population) | 0.96% | 0.80% |
Demographics Similar to South Africans and Okinawans by No Schooling Completed
In terms of no schooling completed, the demographic groups most similar to South Africans are Immigrants from Western Europe (1.8%, a difference of 0.040%), Sioux (1.8%, a difference of 0.72%), Immigrants from Germany (1.8%, a difference of 0.82%), Romanian (1.8%, a difference of 1.3%), and Turkish (1.8%, a difference of 1.7%). Similarly, the demographic groups most similar to Okinawans are Yugoslavian (1.8%, a difference of 0.22%), Immigrants from France (1.8%, a difference of 0.26%), German Russian (1.8%, a difference of 0.66%), Thai (1.8%, a difference of 0.68%), and Basque (1.8%, a difference of 1.3%).
| Demographics | Rating | Rank | No Schooling Completed |
| Immigrants | Western Europe | 99.2 /100 | #88 | Exceptional 1.8% |
| South Africans | 99.1 /100 | #89 | Exceptional 1.8% |
| Sioux | 99.0 /100 | #90 | Exceptional 1.8% |
| Immigrants | Germany | 99.0 /100 | #91 | Exceptional 1.8% |
| Romanians | 98.8 /100 | #92 | Exceptional 1.8% |
| Turks | 98.7 /100 | #93 | Exceptional 1.8% |
| Immigrants | Nonimmigrants | 98.5 /100 | #94 | Exceptional 1.8% |
| Puget Sound Salish | 98.5 /100 | #95 | Exceptional 1.8% |
| Bhutanese | 98.4 /100 | #96 | Exceptional 1.8% |
| Immigrants | Ireland | 98.4 /100 | #97 | Exceptional 1.8% |
| Iranians | 98.2 /100 | #98 | Exceptional 1.8% |
| Choctaw | 98.1 /100 | #99 | Exceptional 1.8% |
| Immigrants | Singapore | 98.0 /100 | #100 | Exceptional 1.8% |
| Immigrants | Czechoslovakia | 97.9 /100 | #101 | Exceptional 1.8% |
| Immigrants | Switzerland | 97.9 /100 | #102 | Exceptional 1.8% |
| Basques | 97.9 /100 | #103 | Exceptional 1.8% |
| Thais | 97.5 /100 | #104 | Exceptional 1.8% |
| German Russians | 97.5 /100 | #105 | Exceptional 1.8% |
| Immigrants | France | 97.3 /100 | #106 | Exceptional 1.8% |
| Yugoslavians | 97.2 /100 | #107 | Exceptional 1.8% |
| Okinawans | 97.1 /100 | #108 | Exceptional 1.8% |