Cambodian vs Okinawan No Schooling Completed
COMPARE
Cambodian
Okinawan
No Schooling Completed
No Schooling Completed Comparison
Cambodians
Okinawans
1.9%
NO SCHOOLING COMPLETED
93.8/ 100
METRIC RATING
124th/ 347
METRIC RANK
1.8%
NO SCHOOLING COMPLETED
97.1/ 100
METRIC RATING
108th/ 347
METRIC RANK
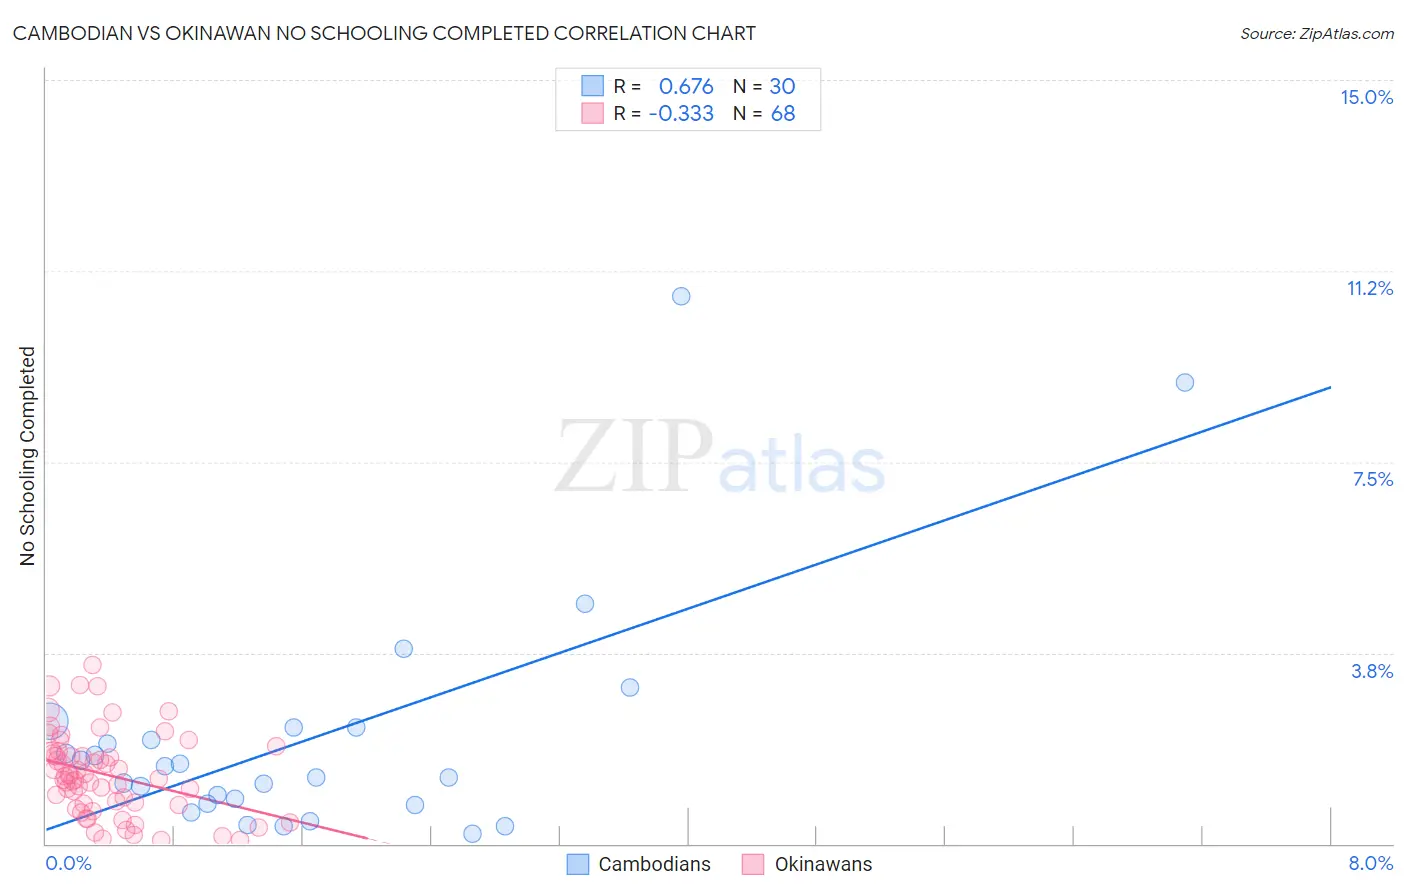
Cambodian vs Okinawan No Schooling Completed Correlation Chart
The statistical analysis conducted on geographies consisting of 102,234,133 people shows a significant positive correlation between the proportion of Cambodians and percentage of population with no schooling in the United States with a correlation coefficient (R) of 0.676 and weighted average of 1.9%. Similarly, the statistical analysis conducted on geographies consisting of 73,597,304 people shows a mild negative correlation between the proportion of Okinawans and percentage of population with no schooling in the United States with a correlation coefficient (R) of -0.333 and weighted average of 1.8%, a difference of 3.0%.
No Schooling Completed Correlation Summary
| Measurement | Cambodian | Okinawan |
| Minimum | 0.20% | 0.067% |
| Maximum | 10.7% | 3.5% |
| Range | 10.5% | 3.5% |
| Mean | 2.1% | 1.4% |
| Median | 1.4% | 1.3% |
| Interquartile 25% (IQ1) | 0.79% | 0.77% |
| Interquartile 75% (IQ3) | 2.3% | 1.8% |
| Interquartile Range (IQR) | 1.5% | 1.0% |
| Standard Deviation (Sample) | 2.4% | 0.81% |
| Standard Deviation (Population) | 2.3% | 0.80% |
Demographics Similar to Cambodians and Okinawans by No Schooling Completed
In terms of no schooling completed, the demographic groups most similar to Cambodians are Immigrants from Kuwait (1.9%, a difference of 0.080%), Immigrants from Europe (1.9%, a difference of 0.090%), Cree (1.9%, a difference of 0.44%), Immigrants from Croatia (1.9%, a difference of 0.47%), and Immigrants from Bulgaria (1.9%, a difference of 0.53%). Similarly, the demographic groups most similar to Okinawans are Yugoslavian (1.8%, a difference of 0.22%), Immigrants from France (1.8%, a difference of 0.26%), Immigrants from Saudi Arabia (1.9%, a difference of 0.35%), Immigrants from Latvia (1.9%, a difference of 0.48%), and Immigrants from Japan (1.9%, a difference of 0.63%).
| Demographics | Rating | Rank | No Schooling Completed |
| Immigrants | France | 97.3 /100 | #106 | Exceptional 1.8% |
| Yugoslavians | 97.2 /100 | #107 | Exceptional 1.8% |
| Okinawans | 97.1 /100 | #108 | Exceptional 1.8% |
| Immigrants | Saudi Arabia | 96.8 /100 | #109 | Exceptional 1.9% |
| Immigrants | Latvia | 96.7 /100 | #110 | Exceptional 1.9% |
| Immigrants | Japan | 96.6 /100 | #111 | Exceptional 1.9% |
| Pueblo | 96.4 /100 | #112 | Exceptional 1.9% |
| Immigrants | Zimbabwe | 96.2 /100 | #113 | Exceptional 1.9% |
| Immigrants | Norway | 96.1 /100 | #114 | Exceptional 1.9% |
| Syrians | 96.0 /100 | #115 | Exceptional 1.9% |
| Lebanese | 96.0 /100 | #116 | Exceptional 1.9% |
| Immigrants | Serbia | 95.8 /100 | #117 | Exceptional 1.9% |
| Spanish | 95.5 /100 | #118 | Exceptional 1.9% |
| Iroquois | 95.1 /100 | #119 | Exceptional 1.9% |
| Immigrants | Bulgaria | 94.6 /100 | #120 | Exceptional 1.9% |
| Immigrants | Croatia | 94.5 /100 | #121 | Exceptional 1.9% |
| Cree | 94.5 /100 | #122 | Exceptional 1.9% |
| Immigrants | Kuwait | 93.9 /100 | #123 | Exceptional 1.9% |
| Cambodians | 93.8 /100 | #124 | Exceptional 1.9% |
| Immigrants | Europe | 93.7 /100 | #125 | Exceptional 1.9% |
| Immigrants | Romania | 92.6 /100 | #126 | Exceptional 1.9% |