Dominican vs Mongolian Male Unemployment
COMPARE
Dominican
Mongolian
Male Unemployment
Male Unemployment Comparison
Dominicans
Mongolians
7.6%
MALE UNEMPLOYMENT
0.0/ 100
METRIC RATING
324th/ 347
METRIC RANK
5.1%
MALE UNEMPLOYMENT
88.4/ 100
METRIC RATING
121st/ 347
METRIC RANK
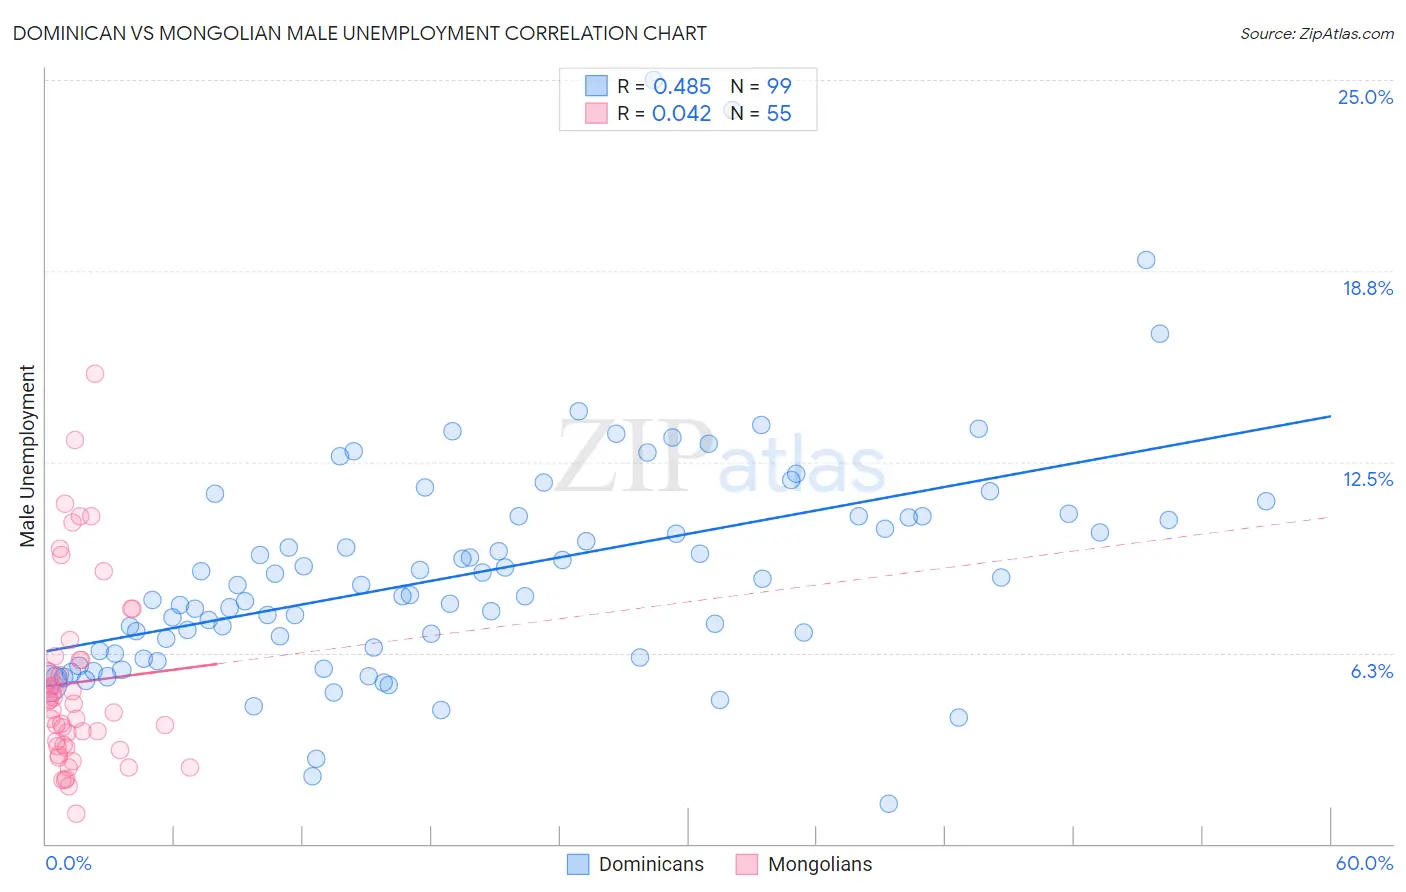
Dominican vs Mongolian Male Unemployment Correlation Chart
The statistical analysis conducted on geographies consisting of 353,678,027 people shows a moderate positive correlation between the proportion of Dominicans and unemployment rate among males in the United States with a correlation coefficient (R) of 0.485 and weighted average of 7.6%. Similarly, the statistical analysis conducted on geographies consisting of 140,285,925 people shows no correlation between the proportion of Mongolians and unemployment rate among males in the United States with a correlation coefficient (R) of 0.042 and weighted average of 5.1%, a difference of 47.4%.
Male Unemployment Correlation Summary
| Measurement | Dominican | Mongolian |
| Minimum | 1.3% | 1.0% |
| Maximum | 25.0% | 15.4% |
| Range | 23.7% | 14.4% |
| Mean | 8.9% | 5.3% |
| Median | 8.1% | 4.6% |
| Interquartile 25% (IQ1) | 6.2% | 3.2% |
| Interquartile 75% (IQ3) | 10.7% | 6.0% |
| Interquartile Range (IQR) | 4.5% | 2.8% |
| Standard Deviation (Sample) | 3.8% | 3.0% |
| Standard Deviation (Population) | 3.8% | 3.0% |
Similar Demographics by Male Unemployment
Demographics Similar to Dominicans by Male Unemployment
In terms of male unemployment, the demographic groups most similar to Dominicans are Immigrants from Grenada (7.6%, a difference of 0.27%), Shoshone (7.6%, a difference of 0.37%), Immigrants from Dominican Republic (7.6%, a difference of 0.48%), Immigrants from Cabo Verde (7.5%, a difference of 1.1%), and Immigrants from St. Vincent and the Grenadines (7.5%, a difference of 1.4%).
| Demographics | Rating | Rank | Male Unemployment |
| Guyanese | 0.0 /100 | #317 | Tragic 7.1% |
| Cape Verdeans | 0.0 /100 | #318 | Tragic 7.1% |
| British West Indians | 0.0 /100 | #319 | Tragic 7.3% |
| Colville | 0.0 /100 | #320 | Tragic 7.4% |
| Immigrants | St. Vincent and the Grenadines | 0.0 /100 | #321 | Tragic 7.5% |
| Immigrants | Cabo Verde | 0.0 /100 | #322 | Tragic 7.5% |
| Immigrants | Grenada | 0.0 /100 | #323 | Tragic 7.6% |
| Dominicans | 0.0 /100 | #324 | Tragic 7.6% |
| Shoshone | 0.0 /100 | #325 | Tragic 7.6% |
| Immigrants | Dominican Republic | 0.0 /100 | #326 | Tragic 7.6% |
| Paiute | 0.0 /100 | #327 | Tragic 7.7% |
| Natives/Alaskans | 0.0 /100 | #328 | Tragic 7.7% |
| Immigrants | Yemen | 0.0 /100 | #329 | Tragic 7.8% |
| Yakama | 0.0 /100 | #330 | Tragic 7.9% |
| Alaska Natives | 0.0 /100 | #331 | Tragic 8.1% |
Demographics Similar to Mongolians by Male Unemployment
In terms of male unemployment, the demographic groups most similar to Mongolians are Ukrainian (5.1%, a difference of 0.010%), French Canadian (5.1%, a difference of 0.030%), Nicaraguan (5.1%, a difference of 0.030%), Cypriot (5.1%, a difference of 0.070%), and Estonian (5.1%, a difference of 0.10%).
| Demographics | Rating | Rank | Male Unemployment |
| Romanians | 89.8 /100 | #114 | Excellent 5.1% |
| Immigrants | Asia | 89.6 /100 | #115 | Excellent 5.1% |
| Immigrants | Denmark | 89.4 /100 | #116 | Excellent 5.1% |
| Estonians | 89.0 /100 | #117 | Excellent 5.1% |
| Cypriots | 88.8 /100 | #118 | Excellent 5.1% |
| French Canadians | 88.6 /100 | #119 | Excellent 5.1% |
| Ukrainians | 88.4 /100 | #120 | Excellent 5.1% |
| Mongolians | 88.4 /100 | #121 | Excellent 5.1% |
| Nicaraguans | 88.2 /100 | #122 | Excellent 5.1% |
| Palestinians | 87.7 /100 | #123 | Excellent 5.1% |
| Immigrants | Latvia | 87.5 /100 | #124 | Excellent 5.1% |
| Immigrants | Lithuania | 87.2 /100 | #125 | Excellent 5.1% |
| Immigrants | Colombia | 86.8 /100 | #126 | Excellent 5.1% |
| Immigrants | Brazil | 86.3 /100 | #127 | Excellent 5.2% |
| Hungarians | 85.1 /100 | #128 | Excellent 5.2% |