Sioux vs Mongolian High School Diploma
COMPARE
Sioux
Mongolian
High School Diploma
High School Diploma Comparison
Sioux
Mongolians
87.9%
HIGH SCHOOL DIPLOMA
2.7/ 100
METRIC RATING
238th/ 347
METRIC RANK
89.9%
HIGH SCHOOL DIPLOMA
91.6/ 100
METRIC RATING
124th/ 347
METRIC RANK
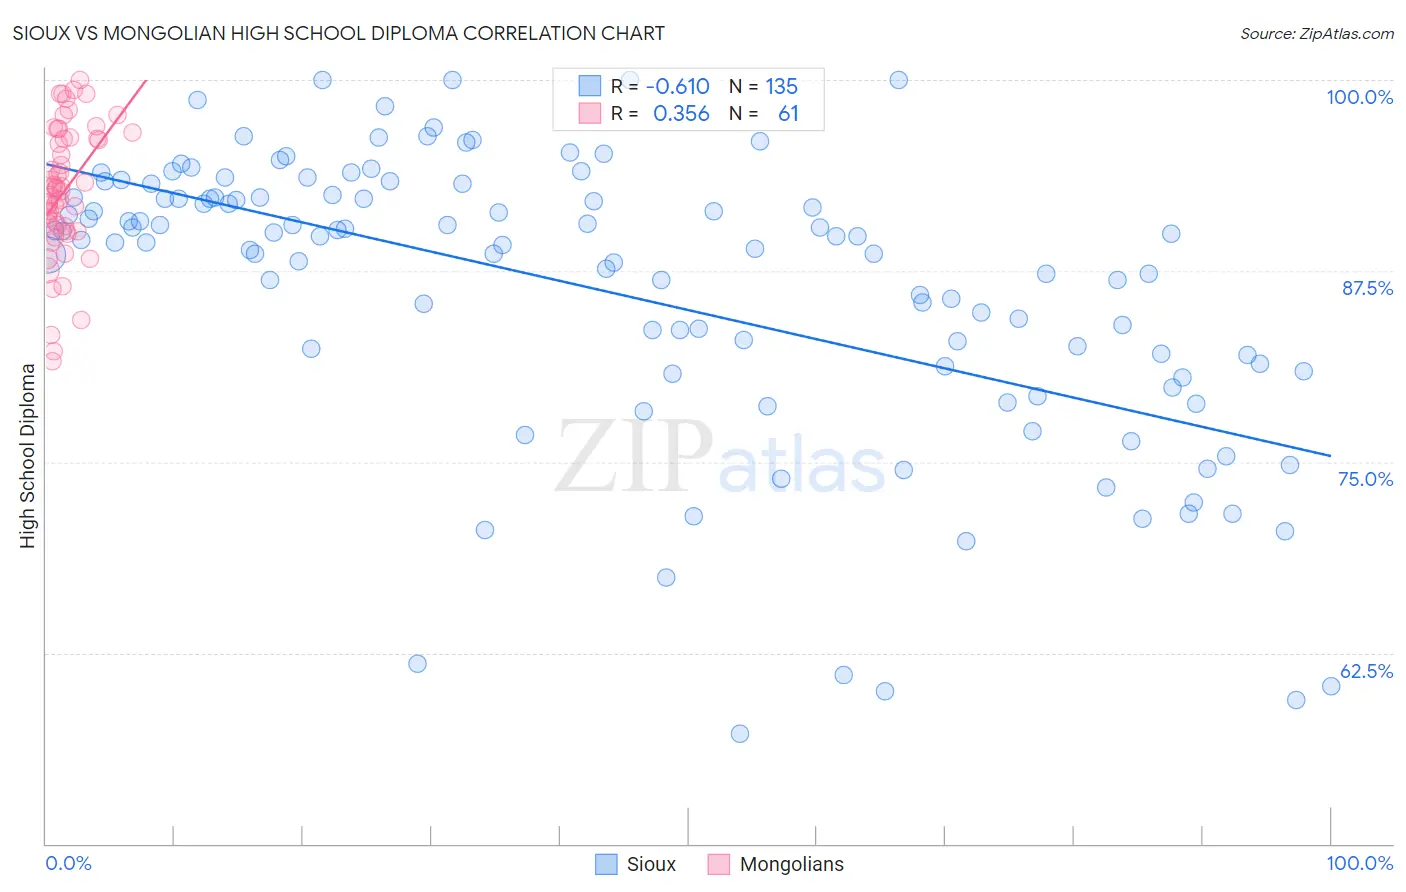
Sioux vs Mongolian High School Diploma Correlation Chart
The statistical analysis conducted on geographies consisting of 234,200,396 people shows a significant negative correlation between the proportion of Sioux and percentage of population with at least high school diploma education in the United States with a correlation coefficient (R) of -0.610 and weighted average of 87.9%. Similarly, the statistical analysis conducted on geographies consisting of 140,362,004 people shows a mild positive correlation between the proportion of Mongolians and percentage of population with at least high school diploma education in the United States with a correlation coefficient (R) of 0.356 and weighted average of 89.9%, a difference of 2.3%.
High School Diploma Correlation Summary
| Measurement | Sioux | Mongolian |
| Minimum | 57.2% | 81.6% |
| Maximum | 100.0% | 100.0% |
| Range | 42.8% | 18.4% |
| Mean | 86.2% | 92.7% |
| Median | 89.4% | 92.8% |
| Interquartile 25% (IQ1) | 81.3% | 90.2% |
| Interquartile 75% (IQ3) | 92.3% | 96.2% |
| Interquartile Range (IQR) | 11.0% | 6.0% |
| Standard Deviation (Sample) | 9.4% | 4.3% |
| Standard Deviation (Population) | 9.4% | 4.3% |
Similar Demographics by High School Diploma
Demographics Similar to Sioux by High School Diploma
In terms of high school diploma, the demographic groups most similar to Sioux are Taiwanese (87.9%, a difference of 0.0%), South American (87.9%, a difference of 0.0%), Subsaharan African (87.9%, a difference of 0.010%), Immigrants from Bahamas (88.0%, a difference of 0.030%), and Immigrants from Panama (88.0%, a difference of 0.050%).
| Demographics | Rating | Rank | High School Diploma |
| Colombians | 3.8 /100 | #231 | Tragic 88.1% |
| Immigrants | Middle Africa | 3.4 /100 | #232 | Tragic 88.0% |
| Immigrants | Panama | 3.1 /100 | #233 | Tragic 88.0% |
| Immigrants | Thailand | 3.1 /100 | #234 | Tragic 88.0% |
| Immigrants | Bahamas | 2.9 /100 | #235 | Tragic 88.0% |
| Sub-Saharan Africans | 2.8 /100 | #236 | Tragic 87.9% |
| Taiwanese | 2.8 /100 | #237 | Tragic 87.9% |
| Sioux | 2.7 /100 | #238 | Tragic 87.9% |
| South Americans | 2.7 /100 | #239 | Tragic 87.9% |
| Comanche | 2.2 /100 | #240 | Tragic 87.9% |
| Immigrants | Uzbekistan | 2.1 /100 | #241 | Tragic 87.8% |
| Cheyenne | 2.1 /100 | #242 | Tragic 87.8% |
| Immigrants | Philippines | 1.9 /100 | #243 | Tragic 87.8% |
| Choctaw | 1.9 /100 | #244 | Tragic 87.8% |
| Peruvians | 1.9 /100 | #245 | Tragic 87.8% |
Demographics Similar to Mongolians by High School Diploma
In terms of high school diploma, the demographic groups most similar to Mongolians are German Russian (90.0%, a difference of 0.020%), Egyptian (89.9%, a difference of 0.020%), Alaska Native (89.9%, a difference of 0.030%), Immigrants from Kazakhstan (90.0%, a difference of 0.10%), and Immigrants from Eastern Asia (89.9%, a difference of 0.10%).
| Demographics | Rating | Rank | High School Diploma |
| Jordanians | 95.4 /100 | #117 | Exceptional 90.2% |
| Israelis | 95.1 /100 | #118 | Exceptional 90.1% |
| Immigrants | Eastern Europe | 94.9 /100 | #119 | Exceptional 90.1% |
| Ottawa | 94.4 /100 | #120 | Exceptional 90.1% |
| Whites/Caucasians | 94.1 /100 | #121 | Exceptional 90.1% |
| Immigrants | Kazakhstan | 93.4 /100 | #122 | Exceptional 90.0% |
| German Russians | 92.0 /100 | #123 | Exceptional 90.0% |
| Mongolians | 91.6 /100 | #124 | Exceptional 89.9% |
| Egyptians | 91.1 /100 | #125 | Exceptional 89.9% |
| Alaska Natives | 91.0 /100 | #126 | Exceptional 89.9% |
| Immigrants | Eastern Asia | 89.2 /100 | #127 | Excellent 89.9% |
| Puget Sound Salish | 89.1 /100 | #128 | Excellent 89.9% |
| Basques | 88.5 /100 | #129 | Excellent 89.8% |
| Immigrants | Ukraine | 87.9 /100 | #130 | Excellent 89.8% |
| Immigrants | Italy | 87.4 /100 | #131 | Excellent 89.8% |