Fijian vs Mongolian High School Diploma
COMPARE
Fijian
Mongolian
High School Diploma
High School Diploma Comparison
Fijians
Mongolians
86.0%
HIGH SCHOOL DIPLOMA
0.0/ 100
METRIC RATING
290th/ 347
METRIC RANK
89.9%
HIGH SCHOOL DIPLOMA
91.6/ 100
METRIC RATING
124th/ 347
METRIC RANK
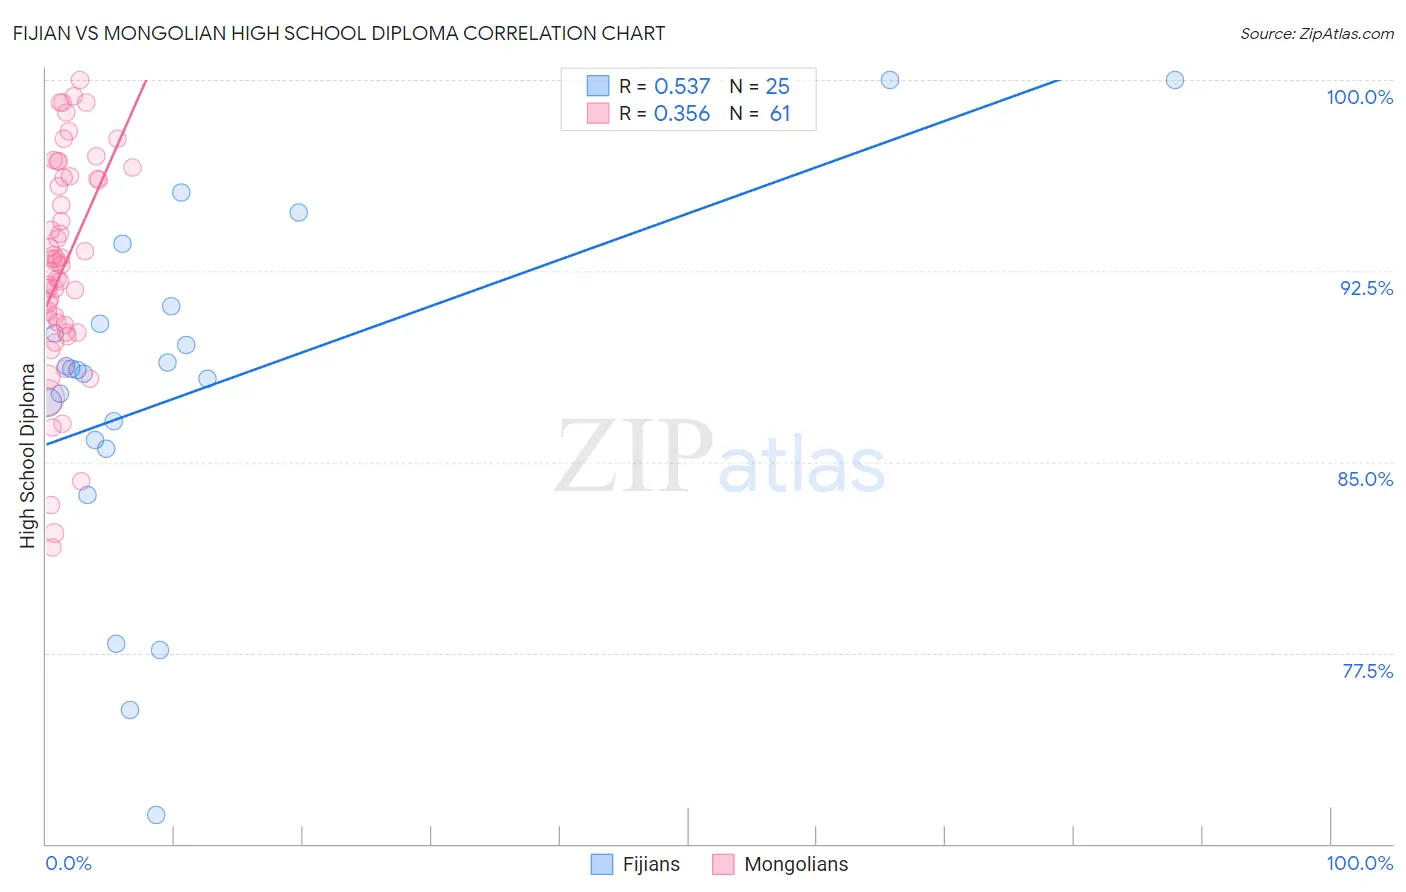
Fijian vs Mongolian High School Diploma Correlation Chart
The statistical analysis conducted on geographies consisting of 55,948,842 people shows a substantial positive correlation between the proportion of Fijians and percentage of population with at least high school diploma education in the United States with a correlation coefficient (R) of 0.537 and weighted average of 86.0%. Similarly, the statistical analysis conducted on geographies consisting of 140,362,004 people shows a mild positive correlation between the proportion of Mongolians and percentage of population with at least high school diploma education in the United States with a correlation coefficient (R) of 0.356 and weighted average of 89.9%, a difference of 4.6%.
High School Diploma Correlation Summary
| Measurement | Fijian | Mongolian |
| Minimum | 71.1% | 81.6% |
| Maximum | 100.0% | 100.0% |
| Range | 28.9% | 18.4% |
| Mean | 87.8% | 92.7% |
| Median | 88.6% | 92.8% |
| Interquartile 25% (IQ1) | 85.7% | 90.2% |
| Interquartile 75% (IQ3) | 90.8% | 96.2% |
| Interquartile Range (IQR) | 5.1% | 6.0% |
| Standard Deviation (Sample) | 6.9% | 4.3% |
| Standard Deviation (Population) | 6.7% | 4.3% |
Similar Demographics by High School Diploma
Demographics Similar to Fijians by High School Diploma
In terms of high school diploma, the demographic groups most similar to Fijians are Yup'ik (86.1%, a difference of 0.070%), Haitian (85.9%, a difference of 0.13%), Japanese (85.9%, a difference of 0.14%), British West Indian (85.9%, a difference of 0.16%), and Ute (86.2%, a difference of 0.18%).
| Demographics | Rating | Rank | High School Diploma |
| Immigrants | Barbados | 0.0 /100 | #283 | Tragic 86.4% |
| Paiute | 0.0 /100 | #284 | Tragic 86.4% |
| Immigrants | West Indies | 0.0 /100 | #285 | Tragic 86.2% |
| Immigrants | St. Vincent and the Grenadines | 0.0 /100 | #286 | Tragic 86.2% |
| Ute | 0.0 /100 | #287 | Tragic 86.2% |
| Immigrants | Vietnam | 0.0 /100 | #288 | Tragic 86.2% |
| Yup'ik | 0.0 /100 | #289 | Tragic 86.1% |
| Fijians | 0.0 /100 | #290 | Tragic 86.0% |
| Haitians | 0.0 /100 | #291 | Tragic 85.9% |
| Japanese | 0.0 /100 | #292 | Tragic 85.9% |
| British West Indians | 0.0 /100 | #293 | Tragic 85.9% |
| Immigrants | Fiji | 0.0 /100 | #294 | Tragic 85.8% |
| Immigrants | Immigrants | 0.0 /100 | #295 | Tragic 85.8% |
| Immigrants | Cambodia | 0.0 /100 | #296 | Tragic 85.6% |
| Immigrants | Grenada | 0.0 /100 | #297 | Tragic 85.6% |
Demographics Similar to Mongolians by High School Diploma
In terms of high school diploma, the demographic groups most similar to Mongolians are German Russian (90.0%, a difference of 0.020%), Egyptian (89.9%, a difference of 0.020%), Alaska Native (89.9%, a difference of 0.030%), Immigrants from Kazakhstan (90.0%, a difference of 0.10%), and Immigrants from Eastern Asia (89.9%, a difference of 0.10%).
| Demographics | Rating | Rank | High School Diploma |
| Jordanians | 95.4 /100 | #117 | Exceptional 90.2% |
| Israelis | 95.1 /100 | #118 | Exceptional 90.1% |
| Immigrants | Eastern Europe | 94.9 /100 | #119 | Exceptional 90.1% |
| Ottawa | 94.4 /100 | #120 | Exceptional 90.1% |
| Whites/Caucasians | 94.1 /100 | #121 | Exceptional 90.1% |
| Immigrants | Kazakhstan | 93.4 /100 | #122 | Exceptional 90.0% |
| German Russians | 92.0 /100 | #123 | Exceptional 90.0% |
| Mongolians | 91.6 /100 | #124 | Exceptional 89.9% |
| Egyptians | 91.1 /100 | #125 | Exceptional 89.9% |
| Alaska Natives | 91.0 /100 | #126 | Exceptional 89.9% |
| Immigrants | Eastern Asia | 89.2 /100 | #127 | Excellent 89.9% |
| Puget Sound Salish | 89.1 /100 | #128 | Excellent 89.9% |
| Basques | 88.5 /100 | #129 | Excellent 89.8% |
| Immigrants | Ukraine | 87.9 /100 | #130 | Excellent 89.8% |
| Immigrants | Italy | 87.4 /100 | #131 | Excellent 89.8% |