Fijian vs Immigrants from Uganda High School Diploma
COMPARE
Fijian
Immigrants from Uganda
High School Diploma
High School Diploma Comparison
Fijians
Immigrants from Uganda
86.0%
HIGH SCHOOL DIPLOMA
0.0/ 100
METRIC RATING
290th/ 347
METRIC RANK
88.9%
HIGH SCHOOL DIPLOMA
32.6/ 100
METRIC RATING
189th/ 347
METRIC RANK
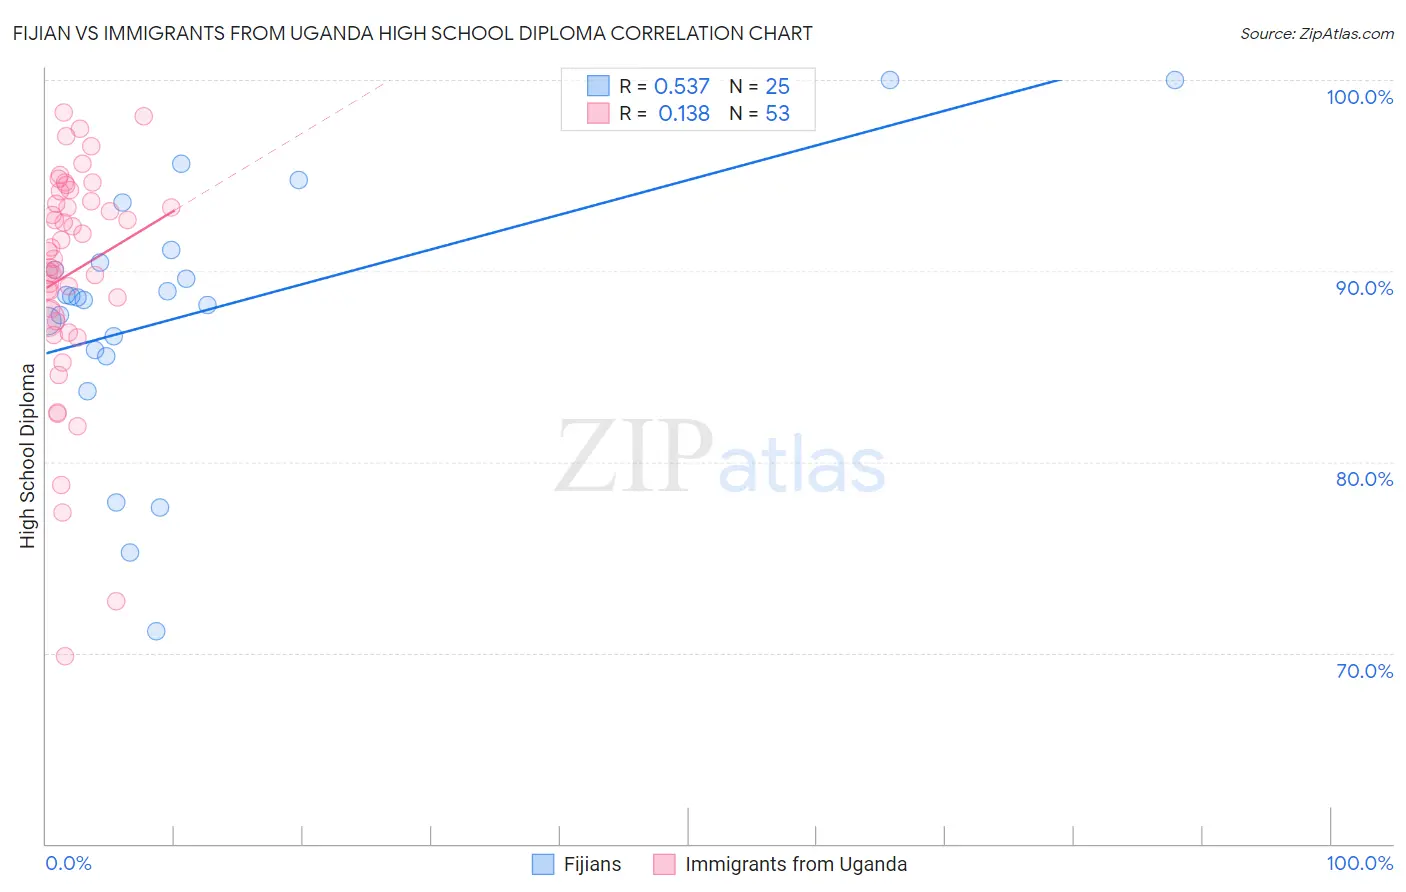
Fijian vs Immigrants from Uganda High School Diploma Correlation Chart
The statistical analysis conducted on geographies consisting of 55,948,842 people shows a substantial positive correlation between the proportion of Fijians and percentage of population with at least high school diploma education in the United States with a correlation coefficient (R) of 0.537 and weighted average of 86.0%. Similarly, the statistical analysis conducted on geographies consisting of 125,981,524 people shows a poor positive correlation between the proportion of Immigrants from Uganda and percentage of population with at least high school diploma education in the United States with a correlation coefficient (R) of 0.138 and weighted average of 88.9%, a difference of 3.4%.
High School Diploma Correlation Summary
| Measurement | Fijian | Immigrants from Uganda |
| Minimum | 71.1% | 69.8% |
| Maximum | 100.0% | 98.3% |
| Range | 28.9% | 28.5% |
| Mean | 87.8% | 89.9% |
| Median | 88.6% | 91.0% |
| Interquartile 25% (IQ1) | 85.7% | 87.4% |
| Interquartile 75% (IQ3) | 90.8% | 93.9% |
| Interquartile Range (IQR) | 5.1% | 6.5% |
| Standard Deviation (Sample) | 6.9% | 6.0% |
| Standard Deviation (Population) | 6.7% | 5.9% |
Similar Demographics by High School Diploma
Demographics Similar to Fijians by High School Diploma
In terms of high school diploma, the demographic groups most similar to Fijians are Yup'ik (86.1%, a difference of 0.070%), Haitian (85.9%, a difference of 0.13%), Japanese (85.9%, a difference of 0.14%), British West Indian (85.9%, a difference of 0.16%), and Ute (86.2%, a difference of 0.18%).
| Demographics | Rating | Rank | High School Diploma |
| Immigrants | Barbados | 0.0 /100 | #283 | Tragic 86.4% |
| Paiute | 0.0 /100 | #284 | Tragic 86.4% |
| Immigrants | West Indies | 0.0 /100 | #285 | Tragic 86.2% |
| Immigrants | St. Vincent and the Grenadines | 0.0 /100 | #286 | Tragic 86.2% |
| Ute | 0.0 /100 | #287 | Tragic 86.2% |
| Immigrants | Vietnam | 0.0 /100 | #288 | Tragic 86.2% |
| Yup'ik | 0.0 /100 | #289 | Tragic 86.1% |
| Fijians | 0.0 /100 | #290 | Tragic 86.0% |
| Haitians | 0.0 /100 | #291 | Tragic 85.9% |
| Japanese | 0.0 /100 | #292 | Tragic 85.9% |
| British West Indians | 0.0 /100 | #293 | Tragic 85.9% |
| Immigrants | Fiji | 0.0 /100 | #294 | Tragic 85.8% |
| Immigrants | Immigrants | 0.0 /100 | #295 | Tragic 85.8% |
| Immigrants | Cambodia | 0.0 /100 | #296 | Tragic 85.6% |
| Immigrants | Grenada | 0.0 /100 | #297 | Tragic 85.6% |
Demographics Similar to Immigrants from Uganda by High School Diploma
In terms of high school diploma, the demographic groups most similar to Immigrants from Uganda are Immigrants from Sudan (88.9%, a difference of 0.010%), Immigrants from Chile (88.9%, a difference of 0.010%), Immigrants from Ethiopia (88.9%, a difference of 0.030%), Immigrants from Eastern Africa (88.9%, a difference of 0.050%), and Guamanian/Chamorro (88.9%, a difference of 0.050%).
| Demographics | Rating | Rank | High School Diploma |
| Spaniards | 43.4 /100 | #182 | Average 89.1% |
| Potawatomi | 42.5 /100 | #183 | Average 89.0% |
| Immigrants | Syria | 39.2 /100 | #184 | Fair 89.0% |
| Ethiopians | 37.0 /100 | #185 | Fair 89.0% |
| Immigrants | Eastern Africa | 35.8 /100 | #186 | Fair 88.9% |
| Guamanians/Chamorros | 35.5 /100 | #187 | Fair 88.9% |
| Immigrants | Sudan | 33.4 /100 | #188 | Fair 88.9% |
| Immigrants | Uganda | 32.6 /100 | #189 | Fair 88.9% |
| Immigrants | Chile | 31.9 /100 | #190 | Fair 88.9% |
| Immigrants | Ethiopia | 30.9 /100 | #191 | Fair 88.9% |
| Moroccans | 29.5 /100 | #192 | Fair 88.8% |
| Immigrants | Oceania | 26.9 /100 | #193 | Fair 88.8% |
| Immigrants | Venezuela | 25.8 /100 | #194 | Fair 88.8% |
| Afghans | 23.9 /100 | #195 | Fair 88.8% |
| Immigrants | Southern Europe | 23.4 /100 | #196 | Fair 88.7% |