Dominican vs Immigrants from Micronesia 11th Grade
COMPARE
Dominican
Immigrants from Micronesia
11th Grade
11th Grade Comparison
Dominicans
Immigrants from Micronesia
87.7%
11TH GRADE
0.0/ 100
METRIC RATING
326th/ 347
METRIC RANK
92.2%
11TH GRADE
17.7/ 100
METRIC RATING
211th/ 347
METRIC RANK
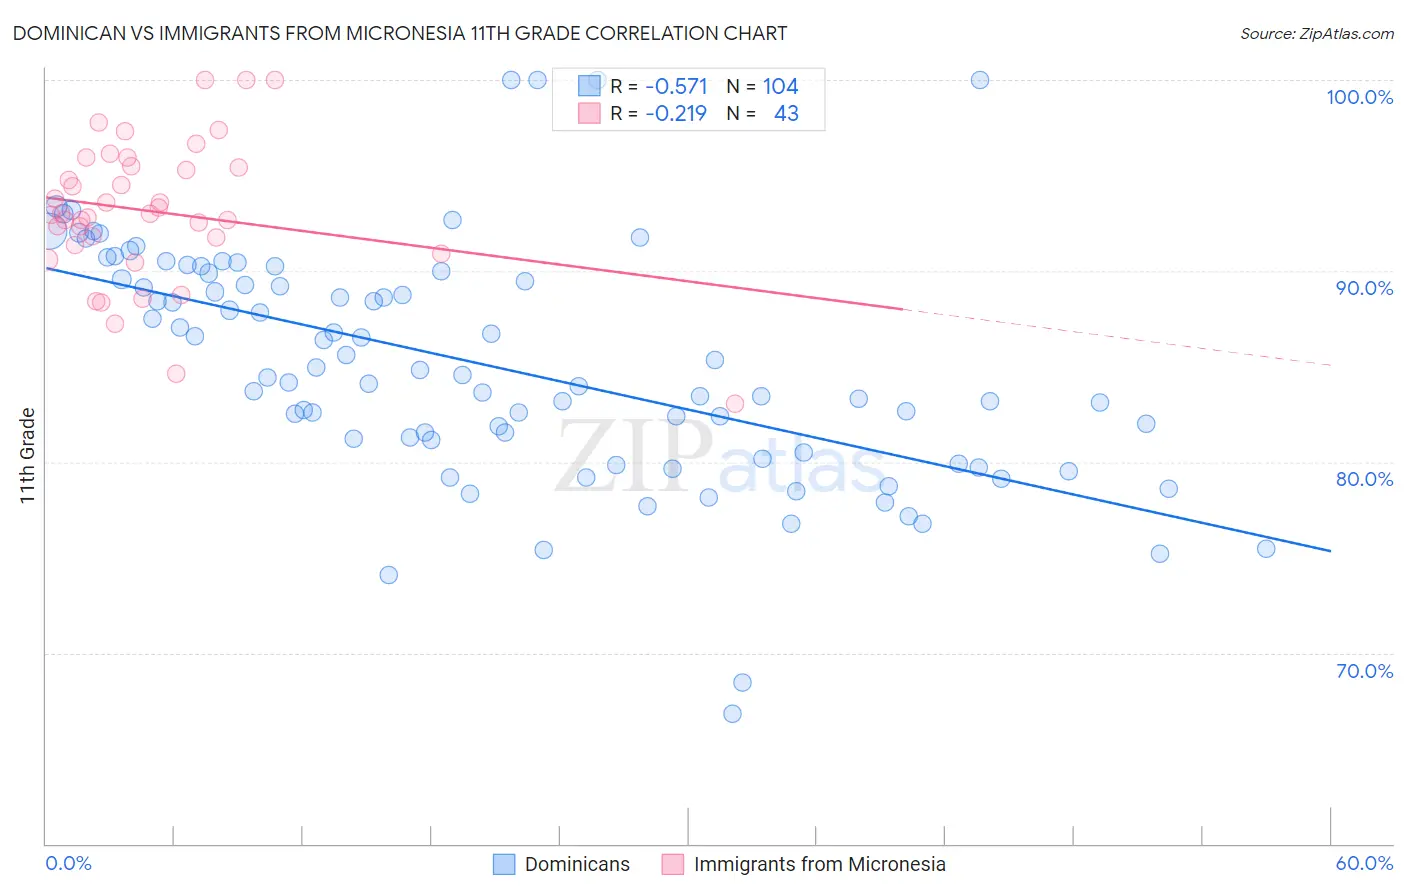
Dominican vs Immigrants from Micronesia 11th Grade Correlation Chart
The statistical analysis conducted on geographies consisting of 355,142,452 people shows a substantial negative correlation between the proportion of Dominicans and percentage of population with at least 11th grade education in the United States with a correlation coefficient (R) of -0.571 and weighted average of 87.7%. Similarly, the statistical analysis conducted on geographies consisting of 61,604,657 people shows a weak negative correlation between the proportion of Immigrants from Micronesia and percentage of population with at least 11th grade education in the United States with a correlation coefficient (R) of -0.219 and weighted average of 92.2%, a difference of 5.1%.
11th Grade Correlation Summary
| Measurement | Dominican | Immigrants from Micronesia |
| Minimum | 66.8% | 83.0% |
| Maximum | 100.0% | 100.0% |
| Range | 33.2% | 17.0% |
| Mean | 85.1% | 93.1% |
| Median | 84.5% | 93.0% |
| Interquartile 25% (IQ1) | 80.8% | 91.4% |
| Interquartile 75% (IQ3) | 89.7% | 95.5% |
| Interquartile Range (IQR) | 8.9% | 4.1% |
| Standard Deviation (Sample) | 6.2% | 3.7% |
| Standard Deviation (Population) | 6.2% | 3.7% |
Similar Demographics by 11th Grade
Demographics Similar to Dominicans by 11th Grade
In terms of 11th grade, the demographic groups most similar to Dominicans are Immigrants from Cabo Verde (87.6%, a difference of 0.020%), Tohono O'odham (87.6%, a difference of 0.080%), Mexican American Indian (87.5%, a difference of 0.15%), Honduran (87.4%, a difference of 0.34%), and Hispanic or Latino (87.3%, a difference of 0.40%).
| Demographics | Rating | Rank | 11th Grade |
| Belizeans | 0.0 /100 | #319 | Tragic 88.8% |
| Immigrants | Armenia | 0.0 /100 | #320 | Tragic 88.8% |
| Immigrants | Belize | 0.0 /100 | #321 | Tragic 88.7% |
| Puerto Ricans | 0.0 /100 | #322 | Tragic 88.4% |
| Pima | 0.0 /100 | #323 | Tragic 88.3% |
| Central American Indians | 0.0 /100 | #324 | Tragic 88.2% |
| Immigrants | Nicaragua | 0.0 /100 | #325 | Tragic 88.1% |
| Dominicans | 0.0 /100 | #326 | Tragic 87.7% |
| Immigrants | Cabo Verde | 0.0 /100 | #327 | Tragic 87.6% |
| Tohono O'odham | 0.0 /100 | #328 | Tragic 87.6% |
| Mexican American Indians | 0.0 /100 | #329 | Tragic 87.5% |
| Hondurans | 0.0 /100 | #330 | Tragic 87.4% |
| Hispanics or Latinos | 0.0 /100 | #331 | Tragic 87.3% |
| Immigrants | Azores | 0.0 /100 | #332 | Tragic 87.2% |
| Immigrants | Yemen | 0.0 /100 | #333 | Tragic 87.1% |
Demographics Similar to Immigrants from Micronesia by 11th Grade
In terms of 11th grade, the demographic groups most similar to Immigrants from Micronesia are Ethiopian (92.2%, a difference of 0.020%), Tongan (92.2%, a difference of 0.030%), Colville (92.2%, a difference of 0.060%), Korean (92.1%, a difference of 0.060%), and Immigrants from Oceania (92.2%, a difference of 0.070%).
| Demographics | Rating | Rank | 11th Grade |
| Immigrants | Hong Kong | 23.3 /100 | #204 | Fair 92.2% |
| Kiowa | 23.2 /100 | #205 | Fair 92.2% |
| Bolivians | 23.2 /100 | #206 | Fair 92.2% |
| Immigrants | Oceania | 22.4 /100 | #207 | Fair 92.2% |
| Colville | 21.8 /100 | #208 | Fair 92.2% |
| Tongans | 19.8 /100 | #209 | Poor 92.2% |
| Ethiopians | 18.8 /100 | #210 | Poor 92.2% |
| Immigrants | Micronesia | 17.7 /100 | #211 | Poor 92.2% |
| Koreans | 14.4 /100 | #212 | Poor 92.1% |
| Immigrants | Ethiopia | 13.9 /100 | #213 | Poor 92.1% |
| Afghans | 12.8 /100 | #214 | Poor 92.1% |
| Immigrants | Southern Europe | 12.5 /100 | #215 | Poor 92.1% |
| Somalis | 11.6 /100 | #216 | Poor 92.1% |
| Immigrants | Sierra Leone | 11.1 /100 | #217 | Poor 92.0% |
| Blackfeet | 10.1 /100 | #218 | Poor 92.0% |