Yup'ik vs Immigrants from Micronesia 11th Grade
COMPARE
Yup'ik
Immigrants from Micronesia
11th Grade
11th Grade Comparison
Yup'ik
Immigrants from Micronesia
91.2%
11TH GRADE
0.3/ 100
METRIC RATING
264th/ 347
METRIC RANK
92.2%
11TH GRADE
17.7/ 100
METRIC RATING
211th/ 347
METRIC RANK
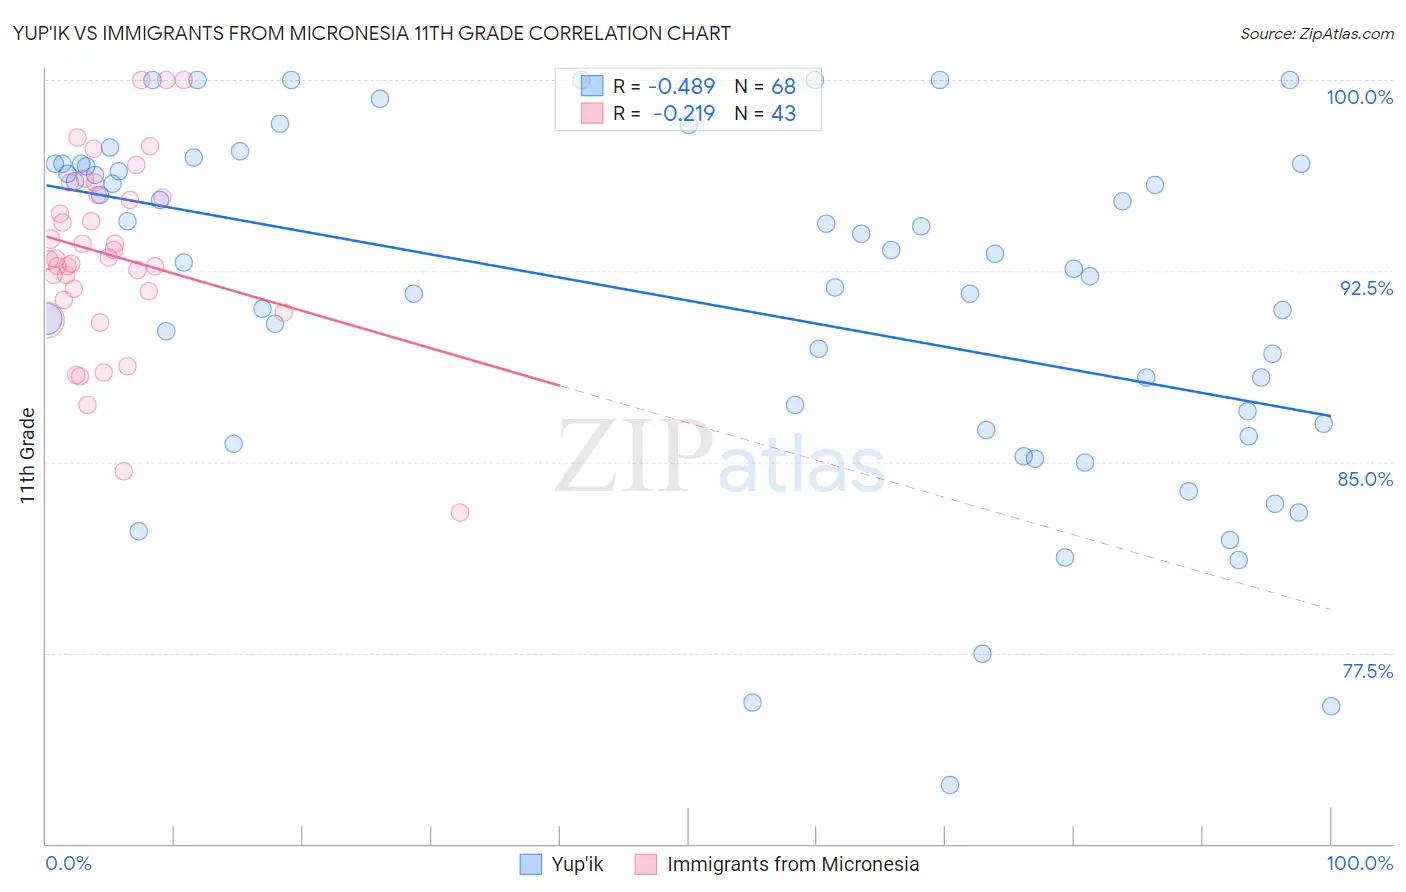
Yup'ik vs Immigrants from Micronesia 11th Grade Correlation Chart
The statistical analysis conducted on geographies consisting of 39,964,654 people shows a moderate negative correlation between the proportion of Yup'ik and percentage of population with at least 11th grade education in the United States with a correlation coefficient (R) of -0.489 and weighted average of 91.2%. Similarly, the statistical analysis conducted on geographies consisting of 61,604,657 people shows a weak negative correlation between the proportion of Immigrants from Micronesia and percentage of population with at least 11th grade education in the United States with a correlation coefficient (R) of -0.219 and weighted average of 92.2%, a difference of 1.1%.
11th Grade Correlation Summary
| Measurement | Yup'ik | Immigrants from Micronesia |
| Minimum | 72.3% | 83.0% |
| Maximum | 100.0% | 100.0% |
| Range | 27.7% | 17.0% |
| Mean | 91.3% | 93.1% |
| Median | 92.7% | 93.0% |
| Interquartile 25% (IQ1) | 86.4% | 91.4% |
| Interquartile 75% (IQ3) | 96.7% | 95.5% |
| Interquartile Range (IQR) | 10.3% | 4.1% |
| Standard Deviation (Sample) | 6.8% | 3.7% |
| Standard Deviation (Population) | 6.7% | 3.7% |
Similar Demographics by 11th Grade
Demographics Similar to Yup'ik by 11th Grade
In terms of 11th grade, the demographic groups most similar to Yup'ik are Pueblo (91.2%, a difference of 0.0%), Immigrants from Ghana (91.2%, a difference of 0.020%), Immigrants from Western Africa (91.2%, a difference of 0.030%), Immigrants from Jamaica (91.2%, a difference of 0.030%), and U.S. Virgin Islander (91.1%, a difference of 0.11%).
| Demographics | Rating | Rank | 11th Grade |
| Cajuns | 0.7 /100 | #257 | Tragic 91.4% |
| Immigrants | Colombia | 0.6 /100 | #258 | Tragic 91.4% |
| Jamaicans | 0.6 /100 | #259 | Tragic 91.4% |
| Spanish Americans | 0.6 /100 | #260 | Tragic 91.4% |
| Taiwanese | 0.6 /100 | #261 | Tragic 91.3% |
| Immigrants | Uruguay | 0.5 /100 | #262 | Tragic 91.3% |
| Immigrants | Ghana | 0.3 /100 | #263 | Tragic 91.2% |
| Yup'ik | 0.3 /100 | #264 | Tragic 91.2% |
| Pueblo | 0.3 /100 | #265 | Tragic 91.2% |
| Immigrants | Western Africa | 0.3 /100 | #266 | Tragic 91.2% |
| Immigrants | Jamaica | 0.3 /100 | #267 | Tragic 91.2% |
| U.S. Virgin Islanders | 0.2 /100 | #268 | Tragic 91.1% |
| Ute | 0.2 /100 | #269 | Tragic 91.1% |
| Trinidadians and Tobagonians | 0.2 /100 | #270 | Tragic 91.1% |
| Immigrants | Peru | 0.1 /100 | #271 | Tragic 91.0% |
Demographics Similar to Immigrants from Micronesia by 11th Grade
In terms of 11th grade, the demographic groups most similar to Immigrants from Micronesia are Ethiopian (92.2%, a difference of 0.020%), Tongan (92.2%, a difference of 0.030%), Colville (92.2%, a difference of 0.060%), Korean (92.1%, a difference of 0.060%), and Immigrants from Oceania (92.2%, a difference of 0.070%).
| Demographics | Rating | Rank | 11th Grade |
| Immigrants | Hong Kong | 23.3 /100 | #204 | Fair 92.2% |
| Kiowa | 23.2 /100 | #205 | Fair 92.2% |
| Bolivians | 23.2 /100 | #206 | Fair 92.2% |
| Immigrants | Oceania | 22.4 /100 | #207 | Fair 92.2% |
| Colville | 21.8 /100 | #208 | Fair 92.2% |
| Tongans | 19.8 /100 | #209 | Poor 92.2% |
| Ethiopians | 18.8 /100 | #210 | Poor 92.2% |
| Immigrants | Micronesia | 17.7 /100 | #211 | Poor 92.2% |
| Koreans | 14.4 /100 | #212 | Poor 92.1% |
| Immigrants | Ethiopia | 13.9 /100 | #213 | Poor 92.1% |
| Afghans | 12.8 /100 | #214 | Poor 92.1% |
| Immigrants | Southern Europe | 12.5 /100 | #215 | Poor 92.1% |
| Somalis | 11.6 /100 | #216 | Poor 92.1% |
| Immigrants | Sierra Leone | 11.1 /100 | #217 | Poor 92.0% |
| Blackfeet | 10.1 /100 | #218 | Poor 92.0% |