French American Indian vs Immigrants from Micronesia 11th Grade
COMPARE
French American Indian
Immigrants from Micronesia
11th Grade
11th Grade Comparison
French American Indians
Immigrants from Micronesia
92.3%
11TH GRADE
30.8/ 100
METRIC RATING
191st/ 347
METRIC RANK
92.2%
11TH GRADE
17.7/ 100
METRIC RATING
211th/ 347
METRIC RANK
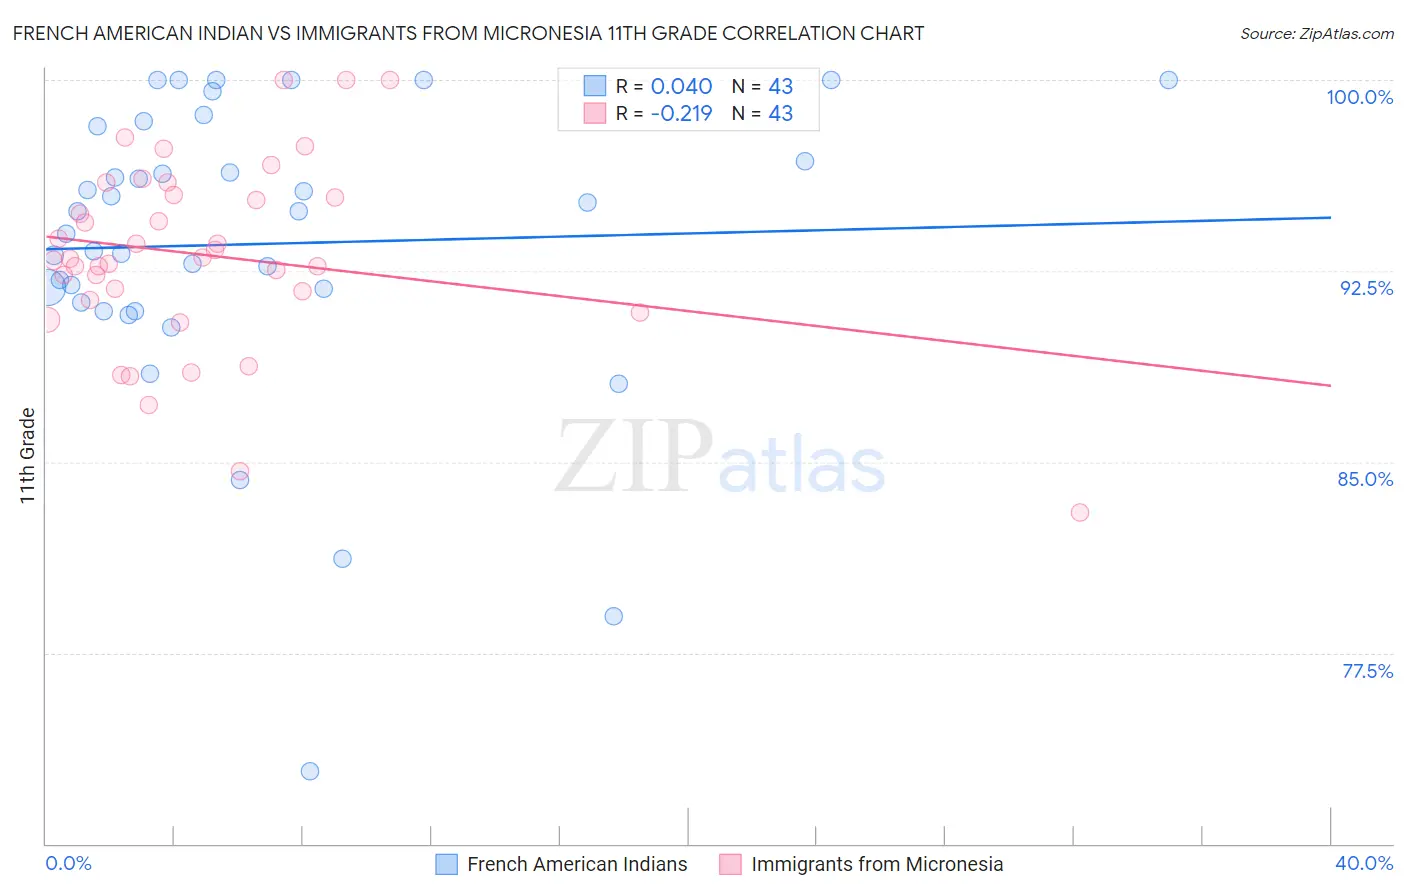
French American Indian vs Immigrants from Micronesia 11th Grade Correlation Chart
The statistical analysis conducted on geographies consisting of 131,976,269 people shows no correlation between the proportion of French American Indians and percentage of population with at least 11th grade education in the United States with a correlation coefficient (R) of 0.040 and weighted average of 92.3%. Similarly, the statistical analysis conducted on geographies consisting of 61,604,657 people shows a weak negative correlation between the proportion of Immigrants from Micronesia and percentage of population with at least 11th grade education in the United States with a correlation coefficient (R) of -0.219 and weighted average of 92.2%, a difference of 0.18%.
11th Grade Correlation Summary
| Measurement | French American Indian | Immigrants from Micronesia |
| Minimum | 72.9% | 83.0% |
| Maximum | 100.0% | 100.0% |
| Range | 27.1% | 17.0% |
| Mean | 93.6% | 93.1% |
| Median | 94.8% | 93.0% |
| Interquartile 25% (IQ1) | 91.3% | 91.4% |
| Interquartile 75% (IQ3) | 98.2% | 95.5% |
| Interquartile Range (IQR) | 6.9% | 4.1% |
| Standard Deviation (Sample) | 5.9% | 3.7% |
| Standard Deviation (Population) | 5.8% | 3.7% |
Demographics Similar to French American Indians and Immigrants from Micronesia by 11th Grade
In terms of 11th grade, the demographic groups most similar to French American Indians are Immigrants from Syria (92.3%, a difference of 0.0%), Moroccan (92.3%, a difference of 0.020%), Sioux (92.3%, a difference of 0.030%), Liberian (92.3%, a difference of 0.050%), and Panamanian (92.3%, a difference of 0.050%). Similarly, the demographic groups most similar to Immigrants from Micronesia are Ethiopian (92.2%, a difference of 0.020%), Tongan (92.2%, a difference of 0.030%), Colville (92.2%, a difference of 0.060%), Immigrants from Oceania (92.2%, a difference of 0.070%), and Kiowa (92.2%, a difference of 0.080%).
| Demographics | Rating | Rank | 11th Grade |
| French American Indians | 30.8 /100 | #191 | Fair 92.3% |
| Immigrants | Syria | 30.4 /100 | #192 | Fair 92.3% |
| Moroccans | 28.7 /100 | #193 | Fair 92.3% |
| Sioux | 28.5 /100 | #194 | Fair 92.3% |
| Liberians | 26.8 /100 | #195 | Fair 92.3% |
| Panamanians | 26.4 /100 | #196 | Fair 92.3% |
| Marshallese | 26.0 /100 | #197 | Fair 92.3% |
| Hawaiians | 25.5 /100 | #198 | Fair 92.3% |
| Immigrants | Uganda | 25.2 /100 | #199 | Fair 92.3% |
| Samoans | 25.1 /100 | #200 | Fair 92.3% |
| Immigrants | China | 25.1 /100 | #201 | Fair 92.3% |
| Immigrants | Eastern Africa | 24.1 /100 | #202 | Fair 92.3% |
| Immigrants | Sudan | 23.5 /100 | #203 | Fair 92.3% |
| Immigrants | Hong Kong | 23.3 /100 | #204 | Fair 92.2% |
| Kiowa | 23.2 /100 | #205 | Fair 92.2% |
| Bolivians | 23.2 /100 | #206 | Fair 92.2% |
| Immigrants | Oceania | 22.4 /100 | #207 | Fair 92.2% |
| Colville | 21.8 /100 | #208 | Fair 92.2% |
| Tongans | 19.8 /100 | #209 | Poor 92.2% |
| Ethiopians | 18.8 /100 | #210 | Poor 92.2% |
| Immigrants | Micronesia | 17.7 /100 | #211 | Poor 92.2% |