Dominican vs Bermudan 11th Grade
COMPARE
Dominican
Bermudan
11th Grade
11th Grade Comparison
Dominicans
Bermudans
87.7%
11TH GRADE
0.0/ 100
METRIC RATING
326th/ 347
METRIC RANK
92.6%
11TH GRADE
62.3/ 100
METRIC RATING
166th/ 347
METRIC RANK
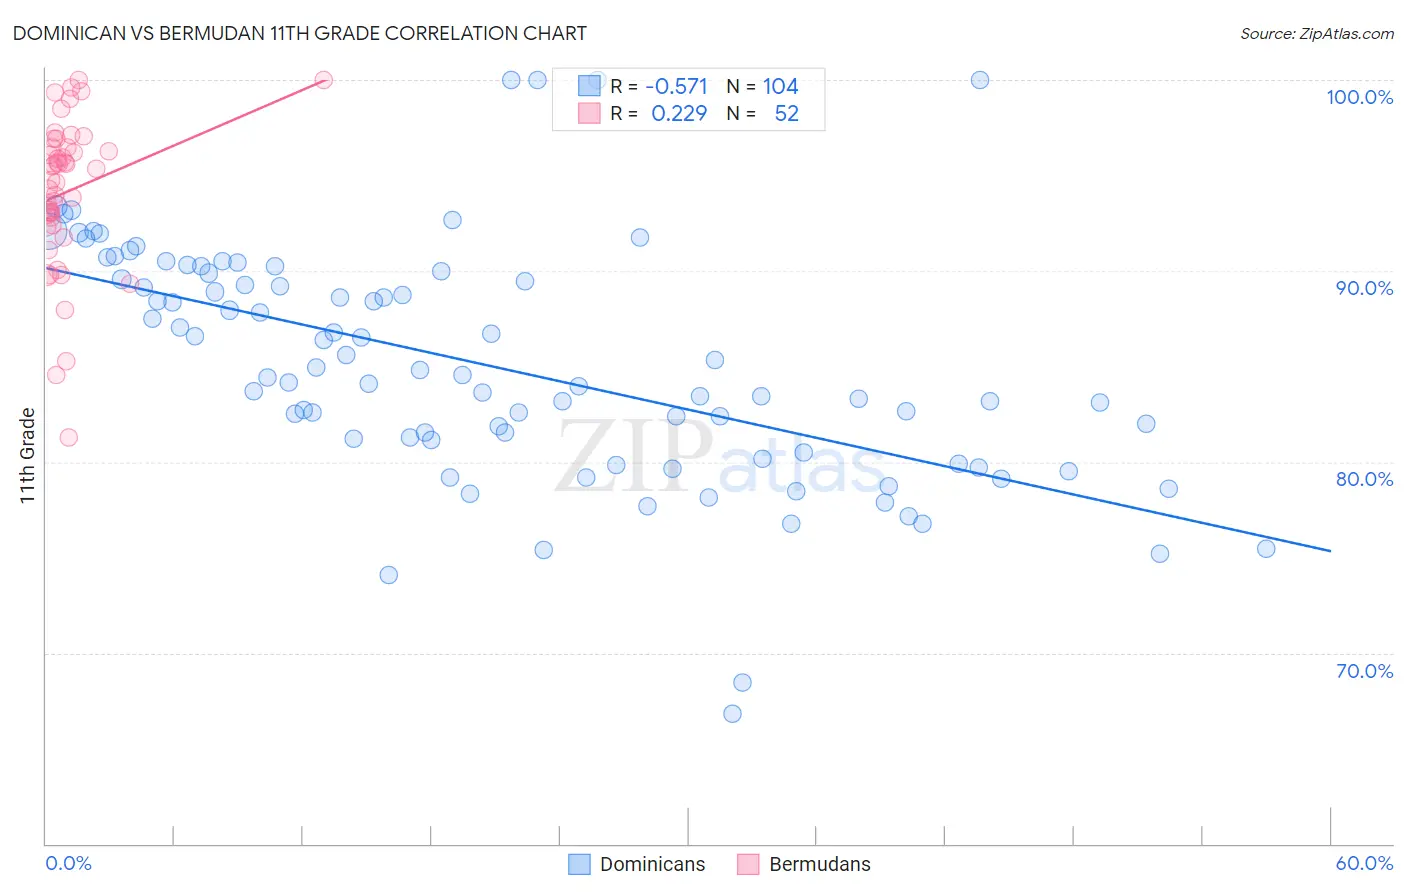
Dominican vs Bermudan 11th Grade Correlation Chart
The statistical analysis conducted on geographies consisting of 355,142,452 people shows a substantial negative correlation between the proportion of Dominicans and percentage of population with at least 11th grade education in the United States with a correlation coefficient (R) of -0.571 and weighted average of 87.7%. Similarly, the statistical analysis conducted on geographies consisting of 55,730,379 people shows a weak positive correlation between the proportion of Bermudans and percentage of population with at least 11th grade education in the United States with a correlation coefficient (R) of 0.229 and weighted average of 92.6%, a difference of 5.7%.
11th Grade Correlation Summary
| Measurement | Dominican | Bermudan |
| Minimum | 66.8% | 81.3% |
| Maximum | 100.0% | 100.0% |
| Range | 33.2% | 18.7% |
| Mean | 85.1% | 94.1% |
| Median | 84.5% | 95.1% |
| Interquartile 25% (IQ1) | 80.8% | 92.6% |
| Interquartile 75% (IQ3) | 89.7% | 96.5% |
| Interquartile Range (IQR) | 8.9% | 3.9% |
| Standard Deviation (Sample) | 6.2% | 3.9% |
| Standard Deviation (Population) | 6.2% | 3.9% |
Similar Demographics by 11th Grade
Demographics Similar to Dominicans by 11th Grade
In terms of 11th grade, the demographic groups most similar to Dominicans are Immigrants from Cabo Verde (87.6%, a difference of 0.020%), Tohono O'odham (87.6%, a difference of 0.080%), Mexican American Indian (87.5%, a difference of 0.15%), Honduran (87.4%, a difference of 0.34%), and Hispanic or Latino (87.3%, a difference of 0.40%).
| Demographics | Rating | Rank | 11th Grade |
| Belizeans | 0.0 /100 | #319 | Tragic 88.8% |
| Immigrants | Armenia | 0.0 /100 | #320 | Tragic 88.8% |
| Immigrants | Belize | 0.0 /100 | #321 | Tragic 88.7% |
| Puerto Ricans | 0.0 /100 | #322 | Tragic 88.4% |
| Pima | 0.0 /100 | #323 | Tragic 88.3% |
| Central American Indians | 0.0 /100 | #324 | Tragic 88.2% |
| Immigrants | Nicaragua | 0.0 /100 | #325 | Tragic 88.1% |
| Dominicans | 0.0 /100 | #326 | Tragic 87.7% |
| Immigrants | Cabo Verde | 0.0 /100 | #327 | Tragic 87.6% |
| Tohono O'odham | 0.0 /100 | #328 | Tragic 87.6% |
| Mexican American Indians | 0.0 /100 | #329 | Tragic 87.5% |
| Hondurans | 0.0 /100 | #330 | Tragic 87.4% |
| Hispanics or Latinos | 0.0 /100 | #331 | Tragic 87.3% |
| Immigrants | Azores | 0.0 /100 | #332 | Tragic 87.2% |
| Immigrants | Yemen | 0.0 /100 | #333 | Tragic 87.1% |
Demographics Similar to Bermudans by 11th Grade
In terms of 11th grade, the demographic groups most similar to Bermudans are Immigrants from Iraq (92.6%, a difference of 0.010%), Alsatian (92.6%, a difference of 0.020%), Spanish (92.7%, a difference of 0.040%), Sierra Leonean (92.6%, a difference of 0.040%), and Nonimmigrants (92.7%, a difference of 0.050%).
| Demographics | Rating | Rank | 11th Grade |
| Americans | 71.7 /100 | #159 | Good 92.7% |
| Immigrants | Lebanon | 70.7 /100 | #160 | Good 92.7% |
| Immigrants | Argentina | 69.8 /100 | #161 | Good 92.7% |
| Paraguayans | 68.7 /100 | #162 | Good 92.7% |
| Immigrants | Nonimmigrants | 66.6 /100 | #163 | Good 92.7% |
| Spanish | 66.2 /100 | #164 | Good 92.7% |
| Immigrants | Iraq | 63.7 /100 | #165 | Good 92.6% |
| Bermudans | 62.3 /100 | #166 | Good 92.6% |
| Alsatians | 60.2 /100 | #167 | Good 92.6% |
| Sierra Leoneans | 58.7 /100 | #168 | Average 92.6% |
| Immigrants | Albania | 57.8 /100 | #169 | Average 92.6% |
| Immigrants | Northern Africa | 57.3 /100 | #170 | Average 92.6% |
| Laotians | 54.4 /100 | #171 | Average 92.6% |
| Immigrants | Pakistan | 52.3 /100 | #172 | Average 92.5% |
| Indians (Asian) | 51.5 /100 | #173 | Average 92.5% |