Immigrants from Nigeria vs Immigrants from Micronesia 11th Grade
COMPARE
Immigrants from Nigeria
Immigrants from Micronesia
11th Grade
11th Grade Comparison
Immigrants from Nigeria
Immigrants from Micronesia
91.4%
11TH GRADE
0.8/ 100
METRIC RATING
252nd/ 347
METRIC RANK
92.2%
11TH GRADE
17.7/ 100
METRIC RATING
211th/ 347
METRIC RANK
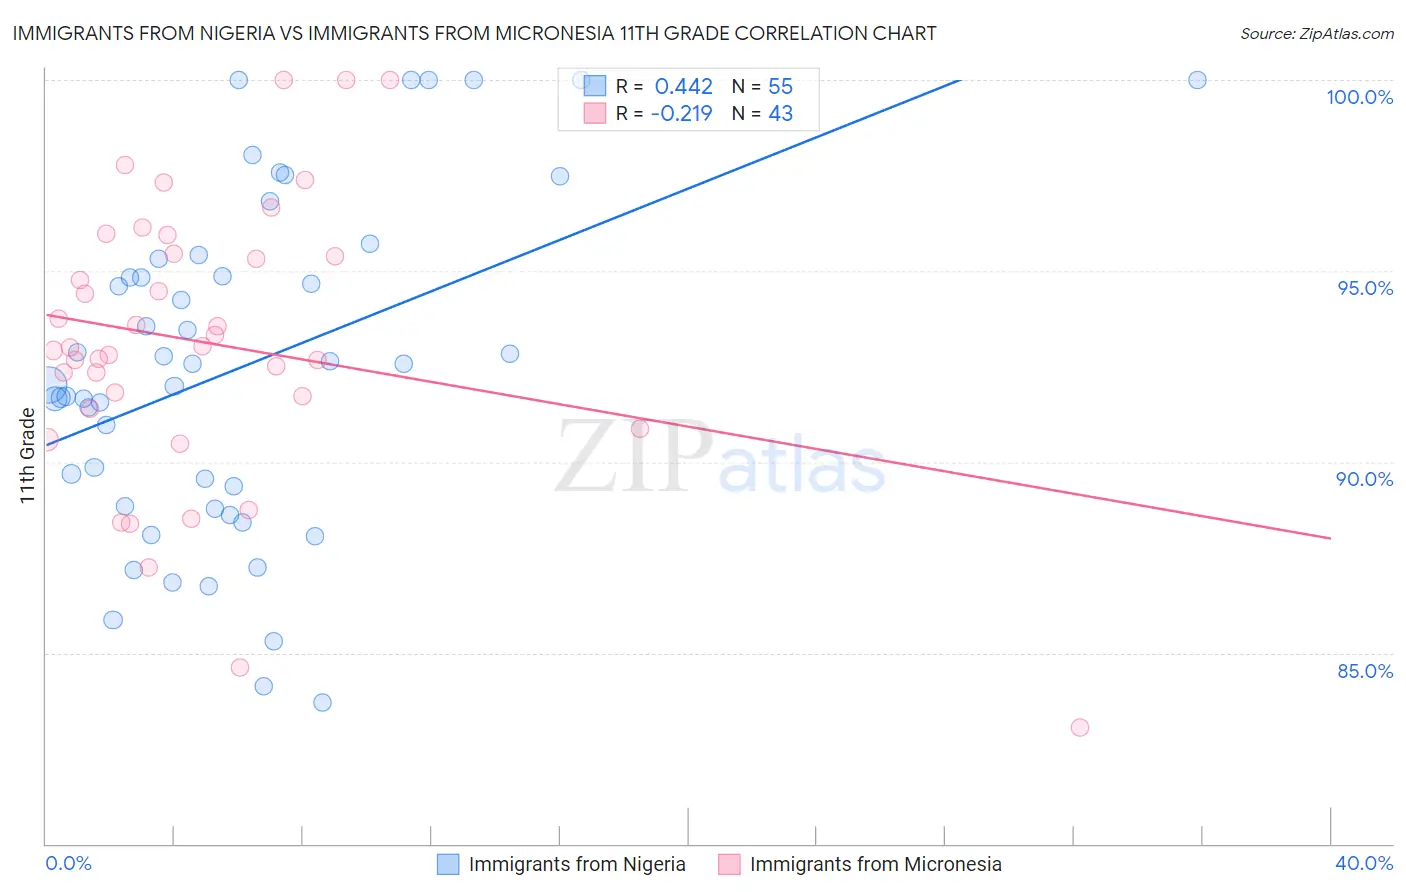
Immigrants from Nigeria vs Immigrants from Micronesia 11th Grade Correlation Chart
The statistical analysis conducted on geographies consisting of 283,441,873 people shows a moderate positive correlation between the proportion of Immigrants from Nigeria and percentage of population with at least 11th grade education in the United States with a correlation coefficient (R) of 0.442 and weighted average of 91.4%. Similarly, the statistical analysis conducted on geographies consisting of 61,604,657 people shows a weak negative correlation between the proportion of Immigrants from Micronesia and percentage of population with at least 11th grade education in the United States with a correlation coefficient (R) of -0.219 and weighted average of 92.2%, a difference of 0.81%.
11th Grade Correlation Summary
| Measurement | Immigrants from Nigeria | Immigrants from Micronesia |
| Minimum | 83.7% | 83.0% |
| Maximum | 100.0% | 100.0% |
| Range | 16.3% | 17.0% |
| Mean | 92.5% | 93.1% |
| Median | 92.6% | 93.0% |
| Interquartile 25% (IQ1) | 88.8% | 91.4% |
| Interquartile 75% (IQ3) | 95.3% | 95.5% |
| Interquartile Range (IQR) | 6.5% | 4.1% |
| Standard Deviation (Sample) | 4.4% | 3.7% |
| Standard Deviation (Population) | 4.3% | 3.7% |
Similar Demographics by 11th Grade
Demographics Similar to Immigrants from Nigeria by 11th Grade
In terms of 11th grade, the demographic groups most similar to Immigrants from Nigeria are Immigrants from Costa Rica (91.4%, a difference of 0.010%), Immigrants from South America (91.4%, a difference of 0.010%), Immigrants from Eritrea (91.4%, a difference of 0.020%), Ghanaian (91.5%, a difference of 0.030%), and Black/African American (91.4%, a difference of 0.030%).
| Demographics | Rating | Rank | 11th Grade |
| Africans | 1.3 /100 | #245 | Tragic 91.5% |
| Seminole | 1.2 /100 | #246 | Tragic 91.5% |
| Immigrants | Philippines | 1.0 /100 | #247 | Tragic 91.5% |
| Immigrants | Uzbekistan | 1.0 /100 | #248 | Tragic 91.5% |
| Peruvians | 1.0 /100 | #249 | Tragic 91.5% |
| Ghanaians | 0.9 /100 | #250 | Tragic 91.5% |
| Immigrants | Costa Rica | 0.9 /100 | #251 | Tragic 91.4% |
| Immigrants | Nigeria | 0.8 /100 | #252 | Tragic 91.4% |
| Immigrants | South America | 0.8 /100 | #253 | Tragic 91.4% |
| Immigrants | Eritrea | 0.7 /100 | #254 | Tragic 91.4% |
| Blacks/African Americans | 0.7 /100 | #255 | Tragic 91.4% |
| Immigrants | Senegal | 0.7 /100 | #256 | Tragic 91.4% |
| Cajuns | 0.7 /100 | #257 | Tragic 91.4% |
| Immigrants | Colombia | 0.6 /100 | #258 | Tragic 91.4% |
| Jamaicans | 0.6 /100 | #259 | Tragic 91.4% |
Demographics Similar to Immigrants from Micronesia by 11th Grade
In terms of 11th grade, the demographic groups most similar to Immigrants from Micronesia are Ethiopian (92.2%, a difference of 0.020%), Tongan (92.2%, a difference of 0.030%), Colville (92.2%, a difference of 0.060%), Korean (92.1%, a difference of 0.060%), and Immigrants from Oceania (92.2%, a difference of 0.070%).
| Demographics | Rating | Rank | 11th Grade |
| Immigrants | Hong Kong | 23.3 /100 | #204 | Fair 92.2% |
| Kiowa | 23.2 /100 | #205 | Fair 92.2% |
| Bolivians | 23.2 /100 | #206 | Fair 92.2% |
| Immigrants | Oceania | 22.4 /100 | #207 | Fair 92.2% |
| Colville | 21.8 /100 | #208 | Fair 92.2% |
| Tongans | 19.8 /100 | #209 | Poor 92.2% |
| Ethiopians | 18.8 /100 | #210 | Poor 92.2% |
| Immigrants | Micronesia | 17.7 /100 | #211 | Poor 92.2% |
| Koreans | 14.4 /100 | #212 | Poor 92.1% |
| Immigrants | Ethiopia | 13.9 /100 | #213 | Poor 92.1% |
| Afghans | 12.8 /100 | #214 | Poor 92.1% |
| Immigrants | Southern Europe | 12.5 /100 | #215 | Poor 92.1% |
| Somalis | 11.6 /100 | #216 | Poor 92.1% |
| Immigrants | Sierra Leone | 11.1 /100 | #217 | Poor 92.0% |
| Blackfeet | 10.1 /100 | #218 | Poor 92.0% |