Dominican vs Immigrants from Micronesia Nursery School
COMPARE
Dominican
Immigrants from Micronesia
Nursery School
Nursery School Comparison
Dominicans
Immigrants from Micronesia
96.8%
NURSERY SCHOOL
0.0/ 100
METRIC RATING
325th/ 347
METRIC RANK
98.0%
NURSERY SCHOOL
55.0/ 100
METRIC RATING
168th/ 347
METRIC RANK
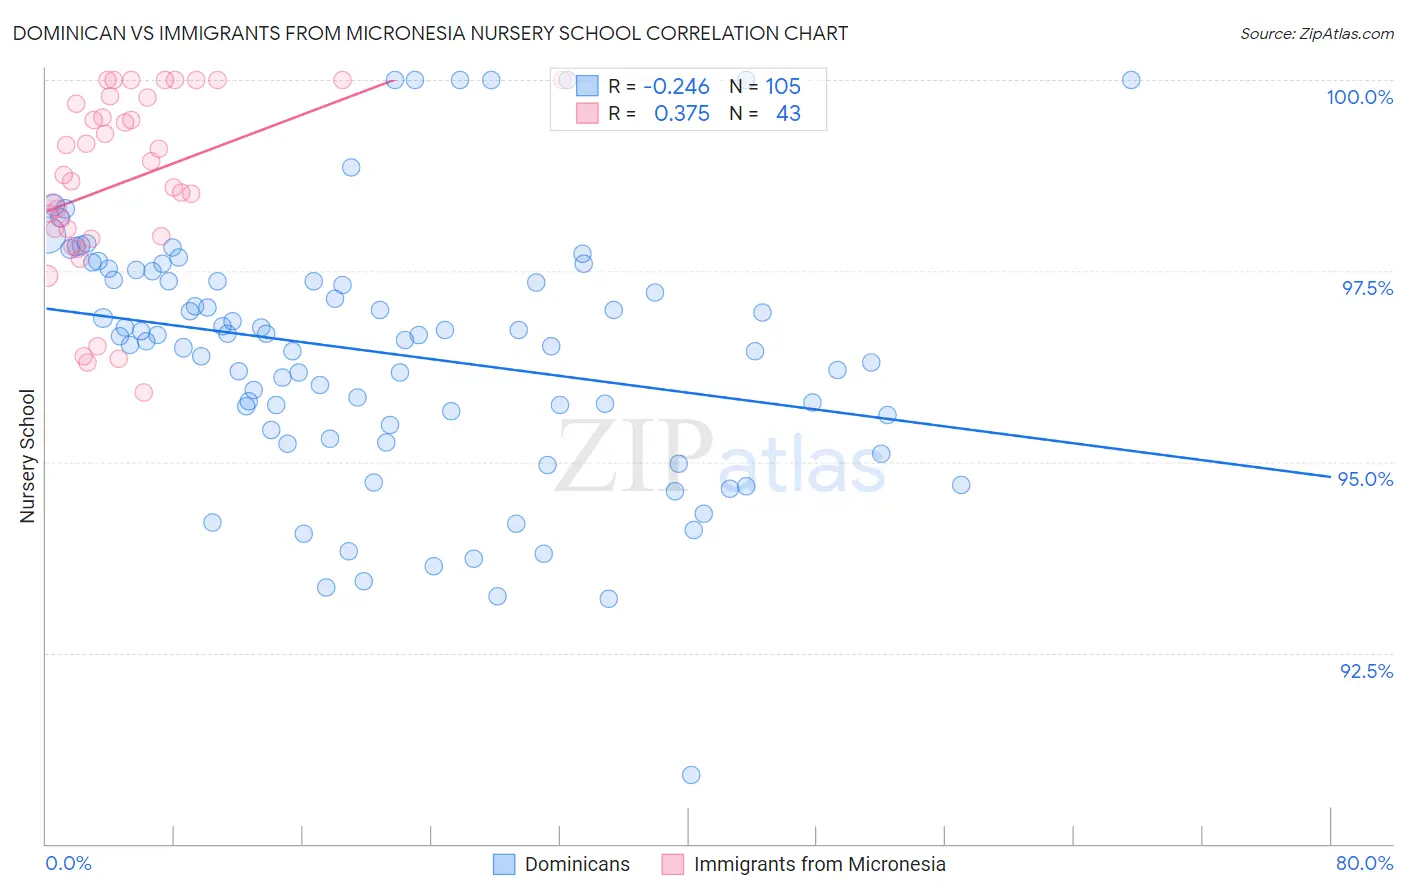
Dominican vs Immigrants from Micronesia Nursery School Correlation Chart
The statistical analysis conducted on geographies consisting of 355,142,603 people shows a weak negative correlation between the proportion of Dominicans and percentage of population with at least nursery school education in the United States with a correlation coefficient (R) of -0.246 and weighted average of 96.8%. Similarly, the statistical analysis conducted on geographies consisting of 61,604,657 people shows a mild positive correlation between the proportion of Immigrants from Micronesia and percentage of population with at least nursery school education in the United States with a correlation coefficient (R) of 0.375 and weighted average of 98.0%, a difference of 1.2%.
Nursery School Correlation Summary
| Measurement | Dominican | Immigrants from Micronesia |
| Minimum | 90.9% | 95.9% |
| Maximum | 100.0% | 100.0% |
| Range | 9.1% | 4.1% |
| Mean | 96.4% | 98.7% |
| Median | 96.6% | 98.8% |
| Interquartile 25% (IQ1) | 95.4% | 98.0% |
| Interquartile 75% (IQ3) | 97.4% | 99.8% |
| Interquartile Range (IQR) | 2.0% | 1.8% |
| Standard Deviation (Sample) | 1.7% | 1.2% |
| Standard Deviation (Population) | 1.7% | 1.2% |
Similar Demographics by Nursery School
Demographics Similar to Dominicans by Nursery School
In terms of nursery school, the demographic groups most similar to Dominicans are Indonesian (96.8%, a difference of 0.0%), Vietnamese (96.8%, a difference of 0.030%), Mexican American Indian (96.9%, a difference of 0.040%), Immigrants from Honduras (96.9%, a difference of 0.040%), and Immigrants from Burma/Myanmar (96.9%, a difference of 0.060%).
| Demographics | Rating | Rank | Nursery School |
| Immigrants | Guyana | 0.0 /100 | #318 | Tragic 96.9% |
| Immigrants | Laos | 0.0 /100 | #319 | Tragic 96.9% |
| Immigrants | Burma/Myanmar | 0.0 /100 | #320 | Tragic 96.9% |
| Immigrants | Bangladesh | 0.0 /100 | #321 | Tragic 96.9% |
| Mexican American Indians | 0.0 /100 | #322 | Tragic 96.9% |
| Immigrants | Honduras | 0.0 /100 | #323 | Tragic 96.9% |
| Vietnamese | 0.0 /100 | #324 | Tragic 96.8% |
| Dominicans | 0.0 /100 | #325 | Tragic 96.8% |
| Indonesians | 0.0 /100 | #326 | Tragic 96.8% |
| Mexicans | 0.0 /100 | #327 | Tragic 96.8% |
| Immigrants | Latin America | 0.0 /100 | #328 | Tragic 96.7% |
| Immigrants | Vietnam | 0.0 /100 | #329 | Tragic 96.7% |
| Japanese | 0.0 /100 | #330 | Tragic 96.7% |
| Immigrants | Armenia | 0.0 /100 | #331 | Tragic 96.7% |
| Yakama | 0.0 /100 | #332 | Tragic 96.6% |
Demographics Similar to Immigrants from Micronesia by Nursery School
In terms of nursery school, the demographic groups most similar to Immigrants from Micronesia are Ugandan (98.0%, a difference of 0.0%), Chilean (98.0%, a difference of 0.0%), Spanish American (98.0%, a difference of 0.0%), Immigrants from Spain (98.0%, a difference of 0.0%), and Immigrants from Korea (98.0%, a difference of 0.0%).
| Demographics | Rating | Rank | Nursery School |
| Immigrants | Eastern Europe | 59.7 /100 | #161 | Average 98.0% |
| Brazilians | 59.4 /100 | #162 | Average 98.0% |
| Immigrants | Italy | 59.0 /100 | #163 | Average 98.0% |
| Ugandans | 56.4 /100 | #164 | Average 98.0% |
| Chileans | 56.4 /100 | #165 | Average 98.0% |
| Spanish Americans | 55.6 /100 | #166 | Average 98.0% |
| Immigrants | Spain | 55.6 /100 | #167 | Average 98.0% |
| Immigrants | Micronesia | 55.0 /100 | #168 | Average 98.0% |
| Immigrants | Korea | 53.8 /100 | #169 | Average 98.0% |
| Bermudans | 53.7 /100 | #170 | Average 98.0% |
| Immigrants | Jordan | 53.4 /100 | #171 | Average 98.0% |
| Immigrants | Brazil | 51.3 /100 | #172 | Average 98.0% |
| Kenyans | 50.2 /100 | #173 | Average 98.0% |
| Navajo | 50.0 /100 | #174 | Average 98.0% |
| Immigrants | Sri Lanka | 49.9 /100 | #175 | Average 98.0% |