Chippewa vs Immigrants from Micronesia 11th Grade
COMPARE
Chippewa
Immigrants from Micronesia
11th Grade
11th Grade Comparison
Chippewa
Immigrants from Micronesia
93.5%
11TH GRADE
98.6/ 100
METRIC RATING
102nd/ 347
METRIC RANK
92.2%
11TH GRADE
17.7/ 100
METRIC RATING
211th/ 347
METRIC RANK
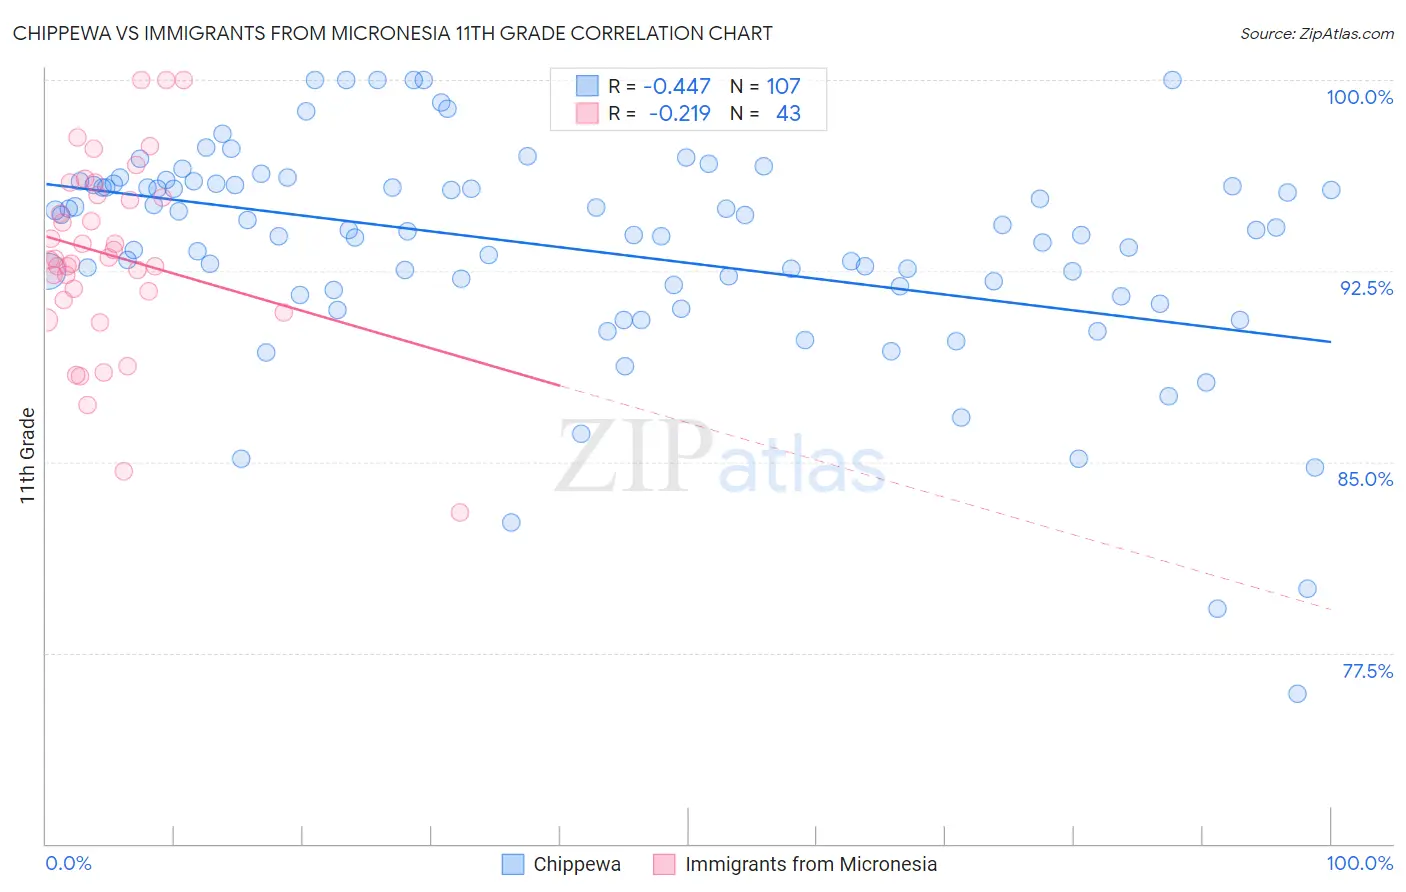
Chippewa vs Immigrants from Micronesia 11th Grade Correlation Chart
The statistical analysis conducted on geographies consisting of 215,068,316 people shows a moderate negative correlation between the proportion of Chippewa and percentage of population with at least 11th grade education in the United States with a correlation coefficient (R) of -0.447 and weighted average of 93.5%. Similarly, the statistical analysis conducted on geographies consisting of 61,604,657 people shows a weak negative correlation between the proportion of Immigrants from Micronesia and percentage of population with at least 11th grade education in the United States with a correlation coefficient (R) of -0.219 and weighted average of 92.2%, a difference of 1.4%.
11th Grade Correlation Summary
| Measurement | Chippewa | Immigrants from Micronesia |
| Minimum | 75.9% | 83.0% |
| Maximum | 100.0% | 100.0% |
| Range | 24.1% | 17.0% |
| Mean | 93.4% | 93.1% |
| Median | 94.1% | 93.0% |
| Interquartile 25% (IQ1) | 91.8% | 91.4% |
| Interquartile 75% (IQ3) | 95.9% | 95.5% |
| Interquartile Range (IQR) | 4.1% | 4.1% |
| Standard Deviation (Sample) | 4.3% | 3.7% |
| Standard Deviation (Population) | 4.3% | 3.7% |
Similar Demographics by 11th Grade
Demographics Similar to Chippewa by 11th Grade
In terms of 11th grade, the demographic groups most similar to Chippewa are Lebanese (93.5%, a difference of 0.0%), Immigrants from Europe (93.5%, a difference of 0.0%), Immigrants from Serbia (93.5%, a difference of 0.0%), Immigrants from Romania (93.5%, a difference of 0.010%), and Immigrants from Croatia (93.5%, a difference of 0.010%).
| Demographics | Rating | Rank | 11th Grade |
| Immigrants | France | 99.0 /100 | #95 | Exceptional 93.6% |
| Immigrants | Turkey | 98.9 /100 | #96 | Exceptional 93.5% |
| Immigrants | Iran | 98.9 /100 | #97 | Exceptional 93.5% |
| Immigrants | Israel | 98.8 /100 | #98 | Exceptional 93.5% |
| Menominee | 98.7 /100 | #99 | Exceptional 93.5% |
| Immigrants | North Macedonia | 98.7 /100 | #100 | Exceptional 93.5% |
| Immigrants | Romania | 98.7 /100 | #101 | Exceptional 93.5% |
| Chippewa | 98.6 /100 | #102 | Exceptional 93.5% |
| Lebanese | 98.6 /100 | #103 | Exceptional 93.5% |
| Immigrants | Europe | 98.6 /100 | #104 | Exceptional 93.5% |
| Immigrants | Serbia | 98.6 /100 | #105 | Exceptional 93.5% |
| Immigrants | Croatia | 98.6 /100 | #106 | Exceptional 93.5% |
| Immigrants | Norway | 98.4 /100 | #107 | Exceptional 93.5% |
| Alaska Natives | 98.4 /100 | #108 | Exceptional 93.5% |
| Immigrants | Kuwait | 98.4 /100 | #109 | Exceptional 93.5% |
Demographics Similar to Immigrants from Micronesia by 11th Grade
In terms of 11th grade, the demographic groups most similar to Immigrants from Micronesia are Ethiopian (92.2%, a difference of 0.020%), Tongan (92.2%, a difference of 0.030%), Colville (92.2%, a difference of 0.060%), Korean (92.1%, a difference of 0.060%), and Immigrants from Oceania (92.2%, a difference of 0.070%).
| Demographics | Rating | Rank | 11th Grade |
| Immigrants | Hong Kong | 23.3 /100 | #204 | Fair 92.2% |
| Kiowa | 23.2 /100 | #205 | Fair 92.2% |
| Bolivians | 23.2 /100 | #206 | Fair 92.2% |
| Immigrants | Oceania | 22.4 /100 | #207 | Fair 92.2% |
| Colville | 21.8 /100 | #208 | Fair 92.2% |
| Tongans | 19.8 /100 | #209 | Poor 92.2% |
| Ethiopians | 18.8 /100 | #210 | Poor 92.2% |
| Immigrants | Micronesia | 17.7 /100 | #211 | Poor 92.2% |
| Koreans | 14.4 /100 | #212 | Poor 92.1% |
| Immigrants | Ethiopia | 13.9 /100 | #213 | Poor 92.1% |
| Afghans | 12.8 /100 | #214 | Poor 92.1% |
| Immigrants | Southern Europe | 12.5 /100 | #215 | Poor 92.1% |
| Somalis | 11.6 /100 | #216 | Poor 92.1% |
| Immigrants | Sierra Leone | 11.1 /100 | #217 | Poor 92.0% |
| Blackfeet | 10.1 /100 | #218 | Poor 92.0% |