Venezuelan vs Immigrants from China College, Under 1 year
COMPARE
Venezuelan
Immigrants from China
College, Under 1 year
College, Under 1 year Comparison
Venezuelans
Immigrants from China
66.7%
COLLEGE, UNDER 1 YEAR
85.9/ 100
METRIC RATING
139th/ 347
METRIC RANK
70.9%
COLLEGE, UNDER 1 YEAR
99.9/ 100
METRIC RATING
30th/ 347
METRIC RANK
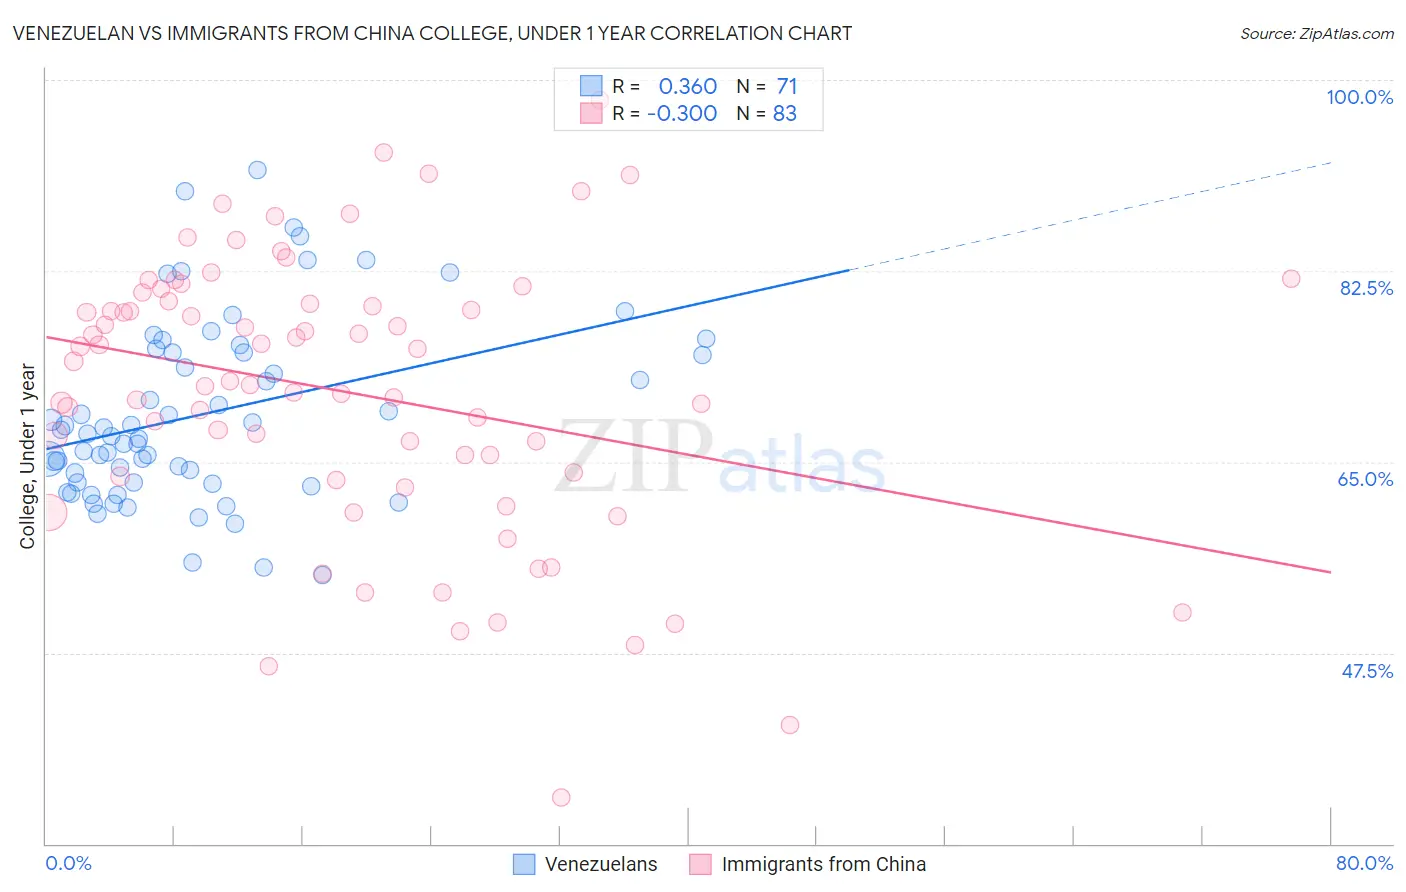
Venezuelan vs Immigrants from China College, Under 1 year Correlation Chart
The statistical analysis conducted on geographies consisting of 306,323,601 people shows a mild positive correlation between the proportion of Venezuelans and percentage of population with at least college, under 1 year education in the United States with a correlation coefficient (R) of 0.360 and weighted average of 66.7%. Similarly, the statistical analysis conducted on geographies consisting of 457,079,223 people shows a mild negative correlation between the proportion of Immigrants from China and percentage of population with at least college, under 1 year education in the United States with a correlation coefficient (R) of -0.300 and weighted average of 70.9%, a difference of 6.2%.
College, Under 1 year Correlation Summary
| Measurement | Venezuelan | Immigrants from China |
| Minimum | 54.6% | 34.2% |
| Maximum | 91.7% | 98.2% |
| Range | 37.1% | 64.0% |
| Mean | 69.4% | 71.4% |
| Median | 67.5% | 72.4% |
| Interquartile 25% (IQ1) | 63.1% | 63.6% |
| Interquartile 75% (IQ3) | 75.1% | 79.7% |
| Interquartile Range (IQR) | 12.0% | 16.1% |
| Standard Deviation (Sample) | 8.3% | 12.8% |
| Standard Deviation (Population) | 8.2% | 12.7% |
Similar Demographics by College, Under 1 year
Demographics Similar to Venezuelans by College, Under 1 year
In terms of college, under 1 year, the demographic groups most similar to Venezuelans are Slavic (66.7%, a difference of 0.0%), Immigrants from Afghanistan (66.7%, a difference of 0.070%), Immigrants from Italy (66.8%, a difference of 0.10%), Immigrants from Chile (66.8%, a difference of 0.14%), and Ugandan (66.8%, a difference of 0.18%).
| Demographics | Rating | Rank | College, Under 1 year |
| Poles | 88.4 /100 | #132 | Excellent 66.9% |
| Immigrants | Brazil | 88.3 /100 | #133 | Excellent 66.9% |
| Iraqis | 88.0 /100 | #134 | Excellent 66.8% |
| Canadians | 87.9 /100 | #135 | Excellent 66.8% |
| Ugandans | 87.8 /100 | #136 | Excellent 66.8% |
| Immigrants | Chile | 87.4 /100 | #137 | Excellent 66.8% |
| Immigrants | Italy | 86.9 /100 | #138 | Excellent 66.8% |
| Venezuelans | 85.9 /100 | #139 | Excellent 66.7% |
| Slavs | 85.9 /100 | #140 | Excellent 66.7% |
| Immigrants | Afghanistan | 85.1 /100 | #141 | Excellent 66.7% |
| English | 82.9 /100 | #142 | Excellent 66.6% |
| Immigrants | Uganda | 82.8 /100 | #143 | Excellent 66.5% |
| Immigrants | Germany | 82.0 /100 | #144 | Excellent 66.5% |
| Immigrants | Kenya | 81.8 /100 | #145 | Excellent 66.5% |
| Kenyans | 81.7 /100 | #146 | Excellent 66.5% |
Demographics Similar to Immigrants from China by College, Under 1 year
In terms of college, under 1 year, the demographic groups most similar to Immigrants from China are Indian (Asian) (70.8%, a difference of 0.11%), Immigrants from Hong Kong (71.0%, a difference of 0.18%), Immigrants from France (71.0%, a difference of 0.18%), Turkish (70.7%, a difference of 0.19%), and Immigrants from Ireland (71.0%, a difference of 0.21%).
| Demographics | Rating | Rank | College, Under 1 year |
| Immigrants | Northern Europe | 100.0 /100 | #23 | Exceptional 71.1% |
| Soviet Union | 100.0 /100 | #24 | Exceptional 71.1% |
| Bulgarians | 100.0 /100 | #25 | Exceptional 71.1% |
| Immigrants | Denmark | 100.0 /100 | #26 | Exceptional 71.0% |
| Immigrants | Ireland | 100.0 /100 | #27 | Exceptional 71.0% |
| Immigrants | Hong Kong | 100.0 /100 | #28 | Exceptional 71.0% |
| Immigrants | France | 100.0 /100 | #29 | Exceptional 71.0% |
| Immigrants | China | 99.9 /100 | #30 | Exceptional 70.9% |
| Indians (Asian) | 99.9 /100 | #31 | Exceptional 70.8% |
| Turks | 99.9 /100 | #32 | Exceptional 70.7% |
| Immigrants | South Africa | 99.9 /100 | #33 | Exceptional 70.6% |
| Estonians | 99.9 /100 | #34 | Exceptional 70.6% |
| Russians | 99.9 /100 | #35 | Exceptional 70.5% |
| Immigrants | Sri Lanka | 99.9 /100 | #36 | Exceptional 70.5% |
| Immigrants | Saudi Arabia | 99.9 /100 | #37 | Exceptional 70.4% |