Immigrants from Philippines vs Immigrants from China College, Under 1 year
COMPARE
Immigrants from Philippines
Immigrants from China
College, Under 1 year
College, Under 1 year Comparison
Immigrants from Philippines
Immigrants from China
64.8%
COLLEGE, UNDER 1 YEAR
30.1/ 100
METRIC RATING
190th/ 347
METRIC RANK
70.9%
COLLEGE, UNDER 1 YEAR
99.9/ 100
METRIC RATING
30th/ 347
METRIC RANK
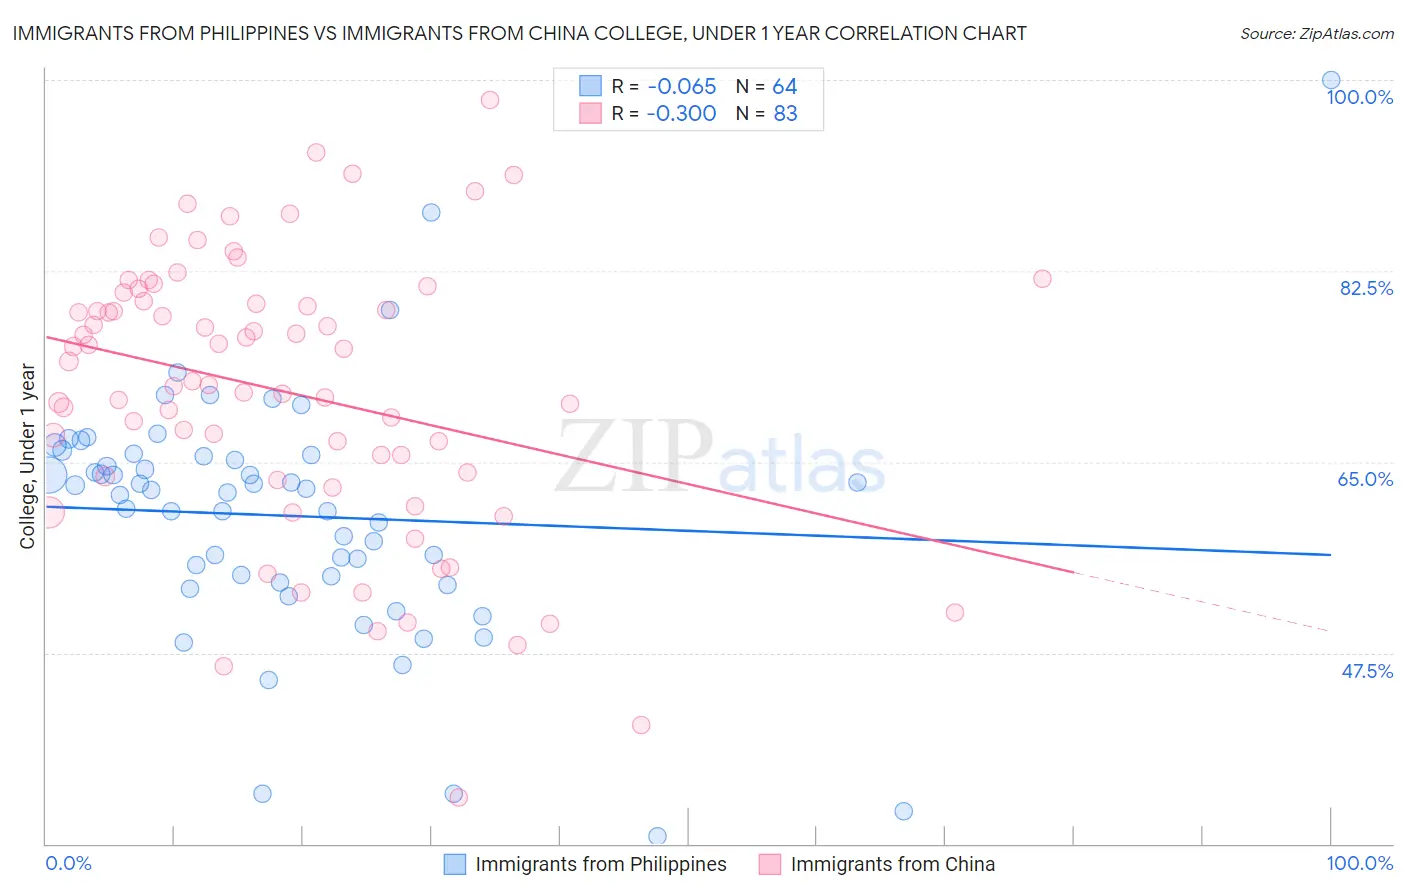
Immigrants from Philippines vs Immigrants from China College, Under 1 year Correlation Chart
The statistical analysis conducted on geographies consisting of 471,303,871 people shows a slight negative correlation between the proportion of Immigrants from Philippines and percentage of population with at least college, under 1 year education in the United States with a correlation coefficient (R) of -0.065 and weighted average of 64.8%. Similarly, the statistical analysis conducted on geographies consisting of 457,079,223 people shows a mild negative correlation between the proportion of Immigrants from China and percentage of population with at least college, under 1 year education in the United States with a correlation coefficient (R) of -0.300 and weighted average of 70.9%, a difference of 9.3%.
College, Under 1 year Correlation Summary
| Measurement | Immigrants from Philippines | Immigrants from China |
| Minimum | 30.7% | 34.2% |
| Maximum | 100.0% | 98.2% |
| Range | 69.3% | 64.0% |
| Mean | 60.1% | 71.4% |
| Median | 62.3% | 72.4% |
| Interquartile 25% (IQ1) | 54.2% | 63.6% |
| Interquartile 75% (IQ3) | 65.6% | 79.7% |
| Interquartile Range (IQR) | 11.3% | 16.1% |
| Standard Deviation (Sample) | 11.4% | 12.8% |
| Standard Deviation (Population) | 11.3% | 12.7% |
Similar Demographics by College, Under 1 year
Demographics Similar to Immigrants from Philippines by College, Under 1 year
In terms of college, under 1 year, the demographic groups most similar to Immigrants from Philippines are Spanish (64.9%, a difference of 0.080%), Immigrants from Albania (64.9%, a difference of 0.10%), Immigrants from Armenia (64.7%, a difference of 0.11%), Immigrants from Thailand (64.7%, a difference of 0.17%), and Slovak (64.7%, a difference of 0.19%).
| Demographics | Rating | Rank | College, Under 1 year |
| Immigrants | Poland | 42.6 /100 | #183 | Average 65.2% |
| Bermudans | 42.0 /100 | #184 | Average 65.2% |
| Sri Lankans | 41.7 /100 | #185 | Average 65.2% |
| Immigrants | Sierra Leone | 39.7 /100 | #186 | Fair 65.1% |
| Immigrants | Southern Europe | 34.3 /100 | #187 | Fair 64.9% |
| Immigrants | Albania | 32.0 /100 | #188 | Fair 64.9% |
| Spanish | 31.6 /100 | #189 | Fair 64.9% |
| Immigrants | Philippines | 30.1 /100 | #190 | Fair 64.8% |
| Immigrants | Armenia | 28.1 /100 | #191 | Fair 64.7% |
| Immigrants | Thailand | 27.0 /100 | #192 | Fair 64.7% |
| Slovaks | 26.7 /100 | #193 | Fair 64.7% |
| Immigrants | Cameroon | 24.6 /100 | #194 | Fair 64.6% |
| Immigrants | South Eastern Asia | 22.1 /100 | #195 | Fair 64.5% |
| Tongans | 21.2 /100 | #196 | Fair 64.5% |
| Costa Ricans | 19.6 /100 | #197 | Poor 64.4% |
Demographics Similar to Immigrants from China by College, Under 1 year
In terms of college, under 1 year, the demographic groups most similar to Immigrants from China are Indian (Asian) (70.8%, a difference of 0.11%), Immigrants from Hong Kong (71.0%, a difference of 0.18%), Immigrants from France (71.0%, a difference of 0.18%), Turkish (70.7%, a difference of 0.19%), and Immigrants from Ireland (71.0%, a difference of 0.21%).
| Demographics | Rating | Rank | College, Under 1 year |
| Immigrants | Northern Europe | 100.0 /100 | #23 | Exceptional 71.1% |
| Soviet Union | 100.0 /100 | #24 | Exceptional 71.1% |
| Bulgarians | 100.0 /100 | #25 | Exceptional 71.1% |
| Immigrants | Denmark | 100.0 /100 | #26 | Exceptional 71.0% |
| Immigrants | Ireland | 100.0 /100 | #27 | Exceptional 71.0% |
| Immigrants | Hong Kong | 100.0 /100 | #28 | Exceptional 71.0% |
| Immigrants | France | 100.0 /100 | #29 | Exceptional 71.0% |
| Immigrants | China | 99.9 /100 | #30 | Exceptional 70.9% |
| Indians (Asian) | 99.9 /100 | #31 | Exceptional 70.8% |
| Turks | 99.9 /100 | #32 | Exceptional 70.7% |
| Immigrants | South Africa | 99.9 /100 | #33 | Exceptional 70.6% |
| Estonians | 99.9 /100 | #34 | Exceptional 70.6% |
| Russians | 99.9 /100 | #35 | Exceptional 70.5% |
| Immigrants | Sri Lanka | 99.9 /100 | #36 | Exceptional 70.5% |
| Immigrants | Saudi Arabia | 99.9 /100 | #37 | Exceptional 70.4% |