Czech vs Immigrants from Zaire Associate's Degree
COMPARE
Czech
Immigrants from Zaire
Associate's Degree
Associate's Degree Comparison
Czechs
Immigrants from Zaire
47.2%
ASSOCIATE'S DEGREE
72.2/ 100
METRIC RATING
153rd/ 347
METRIC RANK
45.0%
ASSOCIATE'S DEGREE
16.6/ 100
METRIC RATING
211th/ 347
METRIC RANK
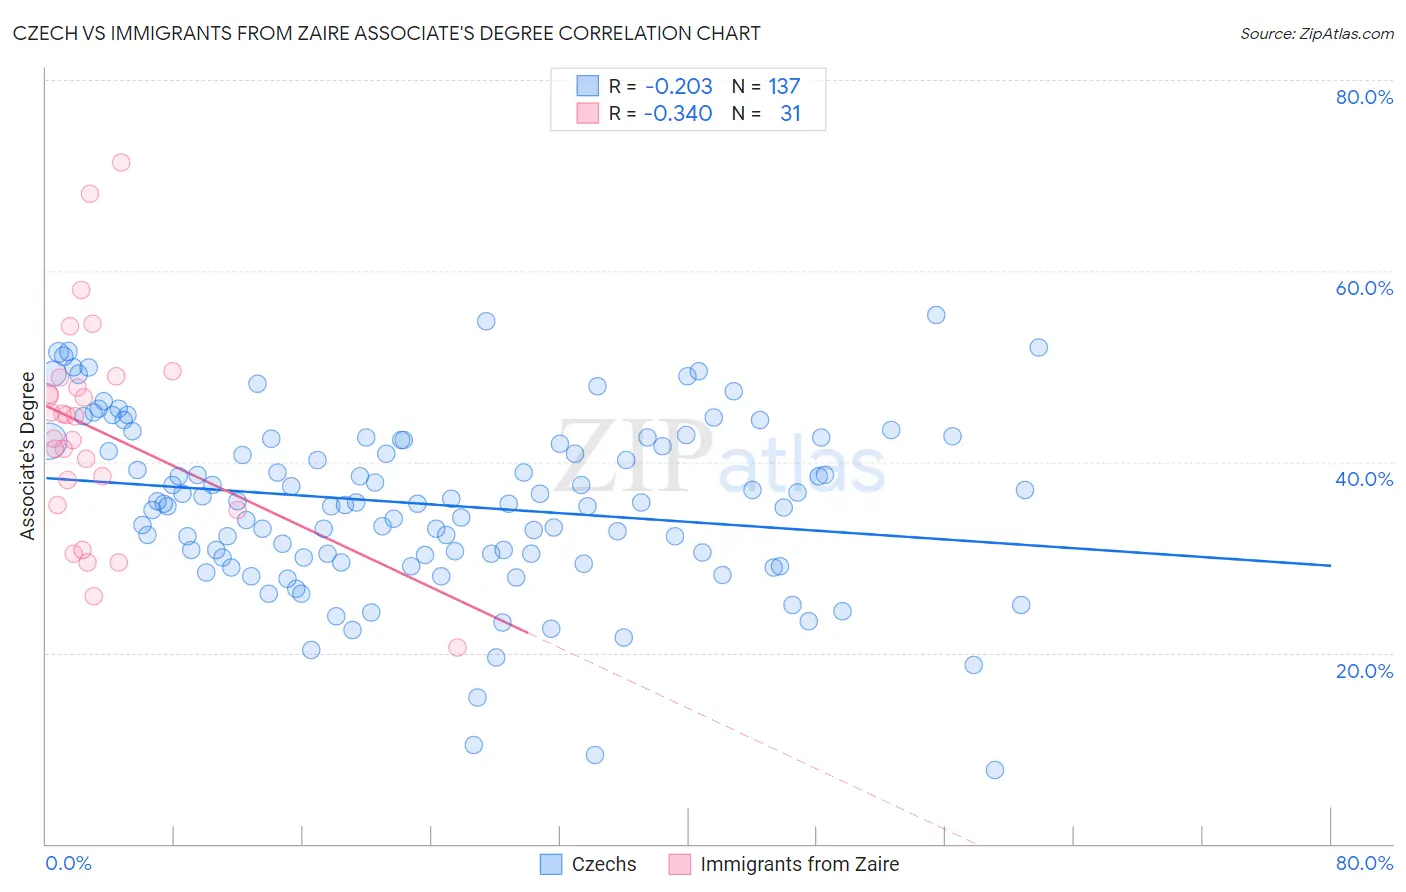
Czech vs Immigrants from Zaire Associate's Degree Correlation Chart
The statistical analysis conducted on geographies consisting of 484,784,602 people shows a weak negative correlation between the proportion of Czechs and percentage of population with at least associate's degree education in the United States with a correlation coefficient (R) of -0.203 and weighted average of 47.2%. Similarly, the statistical analysis conducted on geographies consisting of 107,255,700 people shows a mild negative correlation between the proportion of Immigrants from Zaire and percentage of population with at least associate's degree education in the United States with a correlation coefficient (R) of -0.340 and weighted average of 45.0%, a difference of 5.0%.
Associate's Degree Correlation Summary
| Measurement | Czech | Immigrants from Zaire |
| Minimum | 7.7% | 20.5% |
| Maximum | 55.4% | 71.3% |
| Range | 47.7% | 50.8% |
| Mean | 35.6% | 43.3% |
| Median | 35.7% | 44.8% |
| Interquartile 25% (IQ1) | 30.1% | 35.5% |
| Interquartile 75% (IQ3) | 42.3% | 48.8% |
| Interquartile Range (IQR) | 12.2% | 13.3% |
| Standard Deviation (Sample) | 9.1% | 11.2% |
| Standard Deviation (Population) | 9.0% | 11.0% |
Similar Demographics by Associate's Degree
Demographics Similar to Czechs by Associate's Degree
In terms of associate's degree, the demographic groups most similar to Czechs are Immigrants from Kenya (47.2%, a difference of 0.010%), Kenyan (47.1%, a difference of 0.14%), South American (47.1%, a difference of 0.16%), Sudanese (47.1%, a difference of 0.18%), and Immigrants from Afghanistan (47.3%, a difference of 0.19%).
| Demographics | Rating | Rank | Associate's Degree |
| Immigrants | Sudan | 77.9 /100 | #146 | Good 47.4% |
| Danes | 77.3 /100 | #147 | Good 47.4% |
| South American Indians | 76.7 /100 | #148 | Good 47.4% |
| Immigrants | Armenia | 76.6 /100 | #149 | Good 47.4% |
| Iraqis | 76.2 /100 | #150 | Good 47.4% |
| Immigrants | North Macedonia | 76.0 /100 | #151 | Good 47.4% |
| Immigrants | Afghanistan | 74.3 /100 | #152 | Good 47.3% |
| Czechs | 72.2 /100 | #153 | Good 47.2% |
| Immigrants | Kenya | 72.1 /100 | #154 | Good 47.2% |
| Kenyans | 70.6 /100 | #155 | Good 47.1% |
| South Americans | 70.5 /100 | #156 | Good 47.1% |
| Sudanese | 70.3 /100 | #157 | Good 47.1% |
| Immigrants | Germany | 69.7 /100 | #158 | Good 47.1% |
| Immigrants | Poland | 69.2 /100 | #159 | Good 47.1% |
| Scottish | 65.4 /100 | #160 | Good 46.9% |
Demographics Similar to Immigrants from Zaire by Associate's Degree
In terms of associate's degree, the demographic groups most similar to Immigrants from Zaire are Immigrants from Costa Rica (45.0%, a difference of 0.010%), Immigrants from Philippines (45.0%, a difference of 0.010%), Dutch (45.0%, a difference of 0.13%), Panamanian (45.1%, a difference of 0.23%), and French Canadian (44.9%, a difference of 0.23%).
| Demographics | Rating | Rank | Associate's Degree |
| Nigerians | 19.1 /100 | #204 | Poor 45.1% |
| Immigrants | Thailand | 18.9 /100 | #205 | Poor 45.1% |
| German Russians | 18.9 /100 | #206 | Poor 45.1% |
| Panamanians | 18.4 /100 | #207 | Poor 45.1% |
| Dutch | 17.6 /100 | #208 | Poor 45.0% |
| Immigrants | Costa Rica | 16.7 /100 | #209 | Poor 45.0% |
| Immigrants | Philippines | 16.7 /100 | #210 | Poor 45.0% |
| Immigrants | Zaire | 16.6 /100 | #211 | Poor 45.0% |
| French Canadians | 15.0 /100 | #212 | Poor 44.9% |
| Immigrants | Ghana | 14.2 /100 | #213 | Poor 44.8% |
| Immigrants | Middle Africa | 12.7 /100 | #214 | Poor 44.7% |
| Immigrants | Panama | 12.4 /100 | #215 | Poor 44.7% |
| Immigrants | Nigeria | 11.4 /100 | #216 | Poor 44.6% |
| Immigrants | Immigrants | 10.5 /100 | #217 | Poor 44.5% |
| Spanish | 9.4 /100 | #218 | Tragic 44.4% |