Czech vs Immigrants from Vietnam Associate's Degree
COMPARE
Czech
Immigrants from Vietnam
Associate's Degree
Associate's Degree Comparison
Czechs
Immigrants from Vietnam
47.2%
ASSOCIATE'S DEGREE
72.2/ 100
METRIC RATING
153rd/ 347
METRIC RANK
45.2%
ASSOCIATE'S DEGREE
20.8/ 100
METRIC RATING
201st/ 347
METRIC RANK
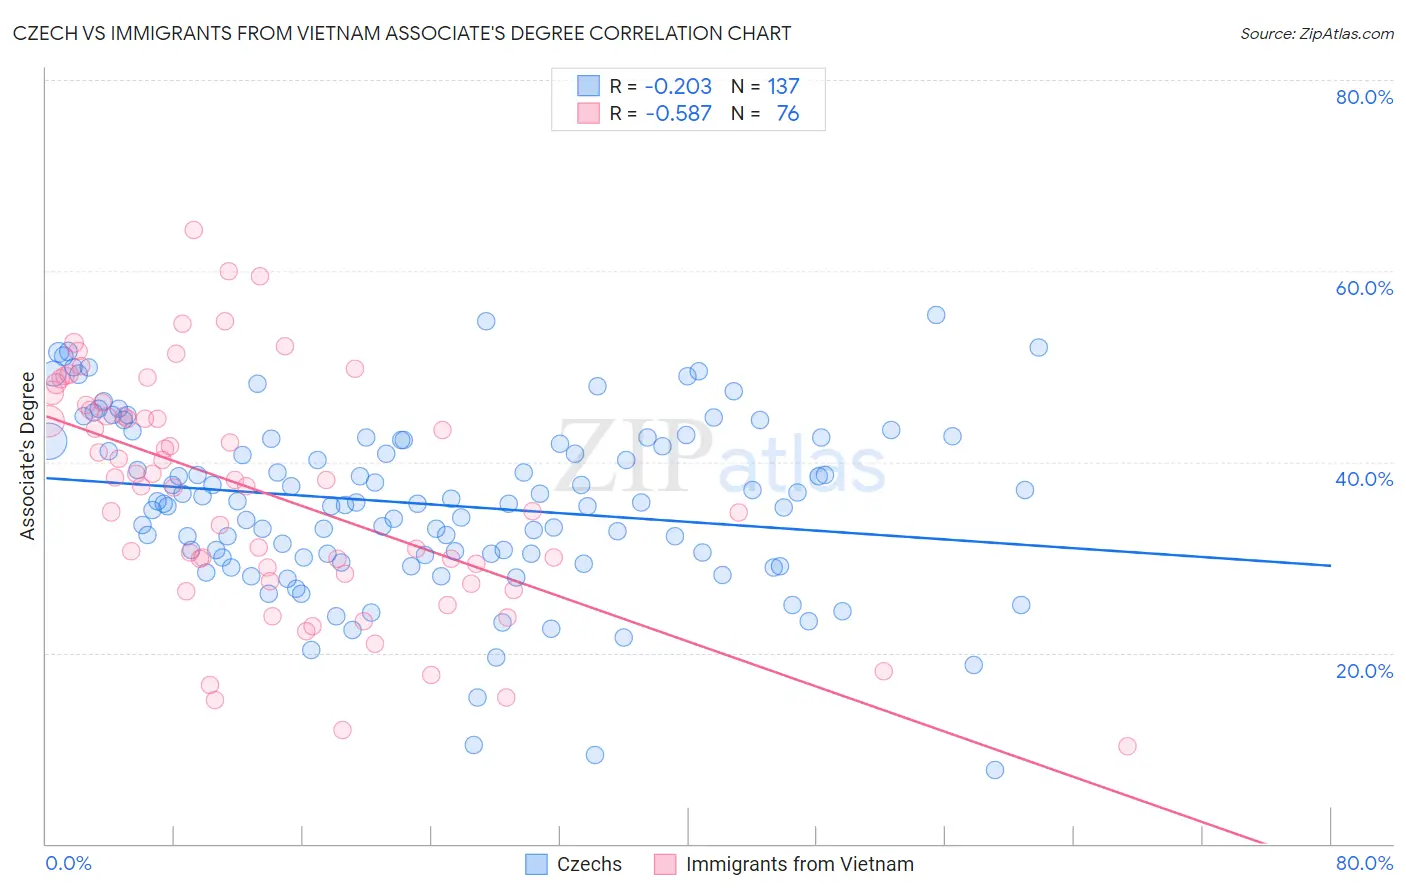
Czech vs Immigrants from Vietnam Associate's Degree Correlation Chart
The statistical analysis conducted on geographies consisting of 484,784,602 people shows a weak negative correlation between the proportion of Czechs and percentage of population with at least associate's degree education in the United States with a correlation coefficient (R) of -0.203 and weighted average of 47.2%. Similarly, the statistical analysis conducted on geographies consisting of 404,825,690 people shows a substantial negative correlation between the proportion of Immigrants from Vietnam and percentage of population with at least associate's degree education in the United States with a correlation coefficient (R) of -0.587 and weighted average of 45.2%, a difference of 4.4%.
Associate's Degree Correlation Summary
| Measurement | Czech | Immigrants from Vietnam |
| Minimum | 7.7% | 10.2% |
| Maximum | 55.4% | 64.3% |
| Range | 47.7% | 54.0% |
| Mean | 35.6% | 36.9% |
| Median | 35.7% | 38.1% |
| Interquartile 25% (IQ1) | 30.1% | 28.6% |
| Interquartile 75% (IQ3) | 42.3% | 45.7% |
| Interquartile Range (IQR) | 12.2% | 17.1% |
| Standard Deviation (Sample) | 9.1% | 12.1% |
| Standard Deviation (Population) | 9.0% | 12.0% |
Similar Demographics by Associate's Degree
Demographics Similar to Czechs by Associate's Degree
In terms of associate's degree, the demographic groups most similar to Czechs are Immigrants from Kenya (47.2%, a difference of 0.010%), Kenyan (47.1%, a difference of 0.14%), South American (47.1%, a difference of 0.16%), Sudanese (47.1%, a difference of 0.18%), and Immigrants from Afghanistan (47.3%, a difference of 0.19%).
| Demographics | Rating | Rank | Associate's Degree |
| Immigrants | Sudan | 77.9 /100 | #146 | Good 47.4% |
| Danes | 77.3 /100 | #147 | Good 47.4% |
| South American Indians | 76.7 /100 | #148 | Good 47.4% |
| Immigrants | Armenia | 76.6 /100 | #149 | Good 47.4% |
| Iraqis | 76.2 /100 | #150 | Good 47.4% |
| Immigrants | North Macedonia | 76.0 /100 | #151 | Good 47.4% |
| Immigrants | Afghanistan | 74.3 /100 | #152 | Good 47.3% |
| Czechs | 72.2 /100 | #153 | Good 47.2% |
| Immigrants | Kenya | 72.1 /100 | #154 | Good 47.2% |
| Kenyans | 70.6 /100 | #155 | Good 47.1% |
| South Americans | 70.5 /100 | #156 | Good 47.1% |
| Sudanese | 70.3 /100 | #157 | Good 47.1% |
| Immigrants | Germany | 69.7 /100 | #158 | Good 47.1% |
| Immigrants | Poland | 69.2 /100 | #159 | Good 47.1% |
| Scottish | 65.4 /100 | #160 | Good 46.9% |
Demographics Similar to Immigrants from Vietnam by Associate's Degree
In terms of associate's degree, the demographic groups most similar to Immigrants from Vietnam are Senegalese (45.2%, a difference of 0.030%), Immigrants from Senegal (45.2%, a difference of 0.040%), Spaniard (45.2%, a difference of 0.050%), Immigrants from Bangladesh (45.2%, a difference of 0.060%), and Immigrants from South Eastern Asia (45.2%, a difference of 0.070%).
| Demographics | Rating | Rank | Associate's Degree |
| Immigrants | Peru | 27.6 /100 | #194 | Fair 45.5% |
| Germans | 26.5 /100 | #195 | Fair 45.5% |
| French | 25.6 /100 | #196 | Fair 45.4% |
| Scotch-Irish | 22.3 /100 | #197 | Fair 45.3% |
| Immigrants | Bangladesh | 21.3 /100 | #198 | Fair 45.2% |
| Immigrants | Senegal | 21.2 /100 | #199 | Fair 45.2% |
| Senegalese | 21.1 /100 | #200 | Fair 45.2% |
| Immigrants | Vietnam | 20.8 /100 | #201 | Fair 45.2% |
| Spaniards | 20.4 /100 | #202 | Fair 45.2% |
| Immigrants | South Eastern Asia | 20.2 /100 | #203 | Fair 45.2% |
| Nigerians | 19.1 /100 | #204 | Poor 45.1% |
| Immigrants | Thailand | 18.9 /100 | #205 | Poor 45.1% |
| German Russians | 18.9 /100 | #206 | Poor 45.1% |
| Panamanians | 18.4 /100 | #207 | Poor 45.1% |
| Dutch | 17.6 /100 | #208 | Poor 45.0% |