Czechoslovakian vs Comanche Female Disability
COMPARE
Czechoslovakian
Comanche
Female Disability
Female Disability Comparison
Czechoslovakians
Comanche
12.7%
FEMALE DISABILITY
0.9/ 100
METRIC RATING
262nd/ 347
METRIC RANK
14.2%
FEMALE DISABILITY
0.0/ 100
METRIC RATING
326th/ 347
METRIC RANK
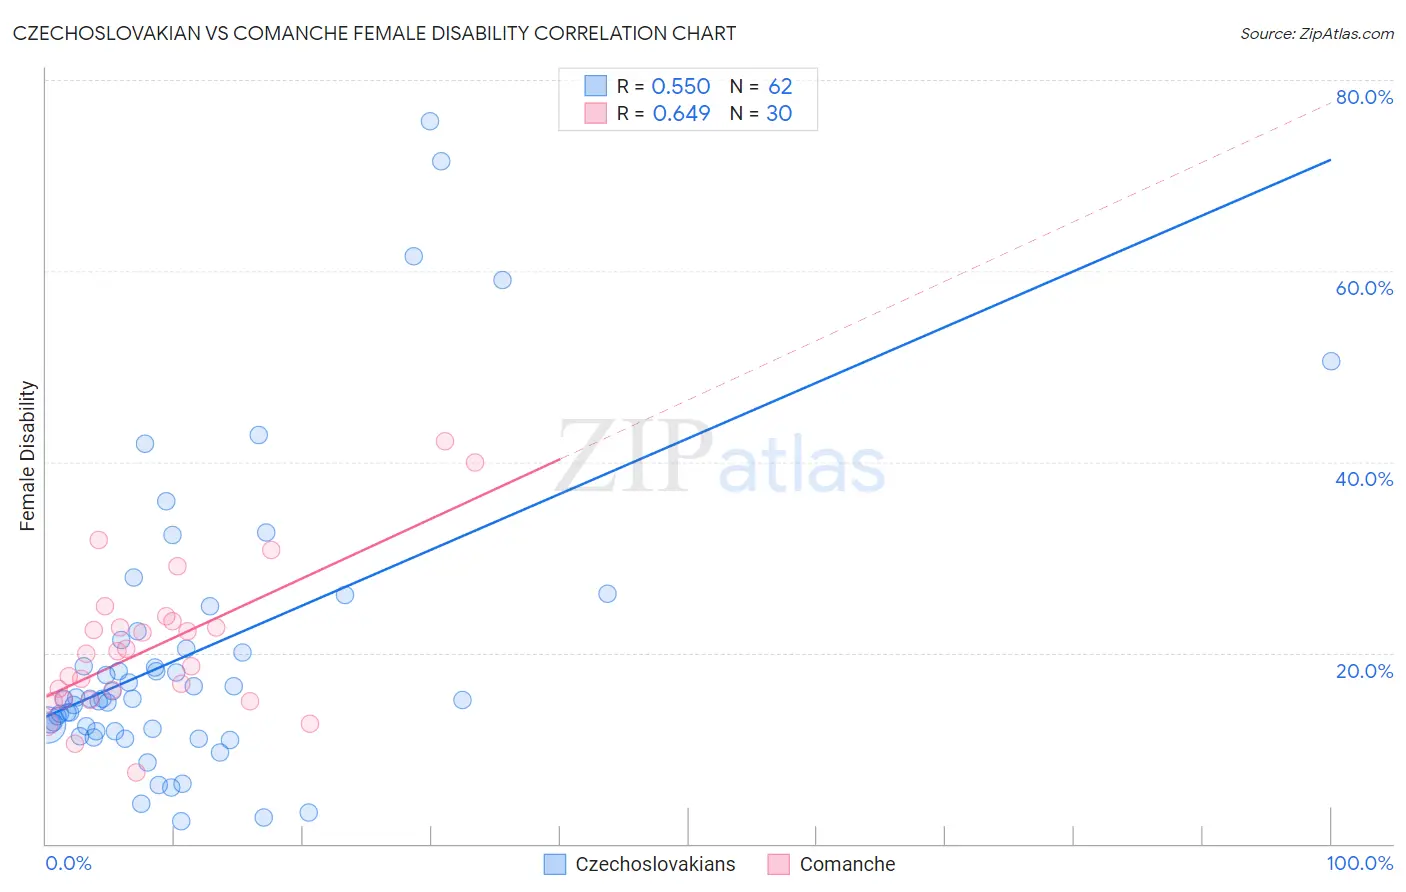
Czechoslovakian vs Comanche Female Disability Correlation Chart
The statistical analysis conducted on geographies consisting of 368,648,423 people shows a substantial positive correlation between the proportion of Czechoslovakians and percentage of females with a disability in the United States with a correlation coefficient (R) of 0.550 and weighted average of 12.7%. Similarly, the statistical analysis conducted on geographies consisting of 109,776,573 people shows a significant positive correlation between the proportion of Comanche and percentage of females with a disability in the United States with a correlation coefficient (R) of 0.649 and weighted average of 14.2%, a difference of 11.3%.
Female Disability Correlation Summary
| Measurement | Czechoslovakian | Comanche |
| Minimum | 2.3% | 7.4% |
| Maximum | 75.7% | 42.1% |
| Range | 73.3% | 34.7% |
| Mean | 20.1% | 20.8% |
| Median | 15.2% | 20.0% |
| Interquartile 25% (IQ1) | 11.8% | 15.1% |
| Interquartile 75% (IQ3) | 21.4% | 23.2% |
| Interquartile Range (IQR) | 9.5% | 8.1% |
| Standard Deviation (Sample) | 15.6% | 7.9% |
| Standard Deviation (Population) | 15.5% | 7.7% |
Similar Demographics by Female Disability
Demographics Similar to Czechoslovakians by Female Disability
In terms of female disability, the demographic groups most similar to Czechoslovakians are Bermudan (12.7%, a difference of 0.070%), Subsaharan African (12.7%, a difference of 0.11%), Immigrants from Armenia (12.7%, a difference of 0.12%), Liberian (12.7%, a difference of 0.20%), and Aleut (12.7%, a difference of 0.20%).
| Demographics | Rating | Rank | Female Disability |
| Immigrants | Germany | 1.3 /100 | #255 | Tragic 12.7% |
| British West Indians | 1.2 /100 | #256 | Tragic 12.7% |
| Liberians | 1.1 /100 | #257 | Tragic 12.7% |
| Aleuts | 1.1 /100 | #258 | Tragic 12.7% |
| Immigrants | Armenia | 1.0 /100 | #259 | Tragic 12.7% |
| Sub-Saharan Africans | 1.0 /100 | #260 | Tragic 12.7% |
| Bermudans | 1.0 /100 | #261 | Tragic 12.7% |
| Czechoslovakians | 0.9 /100 | #262 | Tragic 12.7% |
| Spaniards | 0.7 /100 | #263 | Tragic 12.8% |
| Alaska Natives | 0.6 /100 | #264 | Tragic 12.8% |
| West Indians | 0.5 /100 | #265 | Tragic 12.8% |
| Finns | 0.4 /100 | #266 | Tragic 12.8% |
| Senegalese | 0.4 /100 | #267 | Tragic 12.8% |
| Immigrants | Laos | 0.4 /100 | #268 | Tragic 12.8% |
| Indonesians | 0.4 /100 | #269 | Tragic 12.8% |
Demographics Similar to Comanche by Female Disability
In terms of female disability, the demographic groups most similar to Comanche are Navajo (14.2%, a difference of 0.11%), Native/Alaskan (14.1%, a difference of 0.25%), Black/African American (14.1%, a difference of 0.27%), Pueblo (14.1%, a difference of 0.43%), and Potawatomi (14.1%, a difference of 0.44%).
| Demographics | Rating | Rank | Female Disability |
| Iroquois | 0.0 /100 | #319 | Tragic 14.0% |
| Americans | 0.0 /100 | #320 | Tragic 14.1% |
| Potawatomi | 0.0 /100 | #321 | Tragic 14.1% |
| Pueblo | 0.0 /100 | #322 | Tragic 14.1% |
| Blacks/African Americans | 0.0 /100 | #323 | Tragic 14.1% |
| Natives/Alaskans | 0.0 /100 | #324 | Tragic 14.1% |
| Navajo | 0.0 /100 | #325 | Tragic 14.2% |
| Comanche | 0.0 /100 | #326 | Tragic 14.2% |
| Ottawa | 0.0 /100 | #327 | Tragic 14.2% |
| Cape Verdeans | 0.0 /100 | #328 | Tragic 14.2% |
| Osage | 0.0 /100 | #329 | Tragic 14.3% |
| Yuman | 0.0 /100 | #330 | Tragic 14.5% |
| Immigrants | Cabo Verde | 0.0 /100 | #331 | Tragic 14.6% |
| Pima | 0.0 /100 | #332 | Tragic 14.8% |
| Immigrants | Azores | 0.0 /100 | #333 | Tragic 14.9% |