Czechoslovakian vs Belizean Bachelor's Degree
COMPARE
Czechoslovakian
Belizean
Bachelor's Degree
Bachelor's Degree Comparison
Czechoslovakians
Belizeans
37.0%
BACHELOR'S DEGREE
29.2/ 100
METRIC RATING
197th/ 347
METRIC RANK
32.8%
BACHELOR'S DEGREE
0.4/ 100
METRIC RATING
263rd/ 347
METRIC RANK
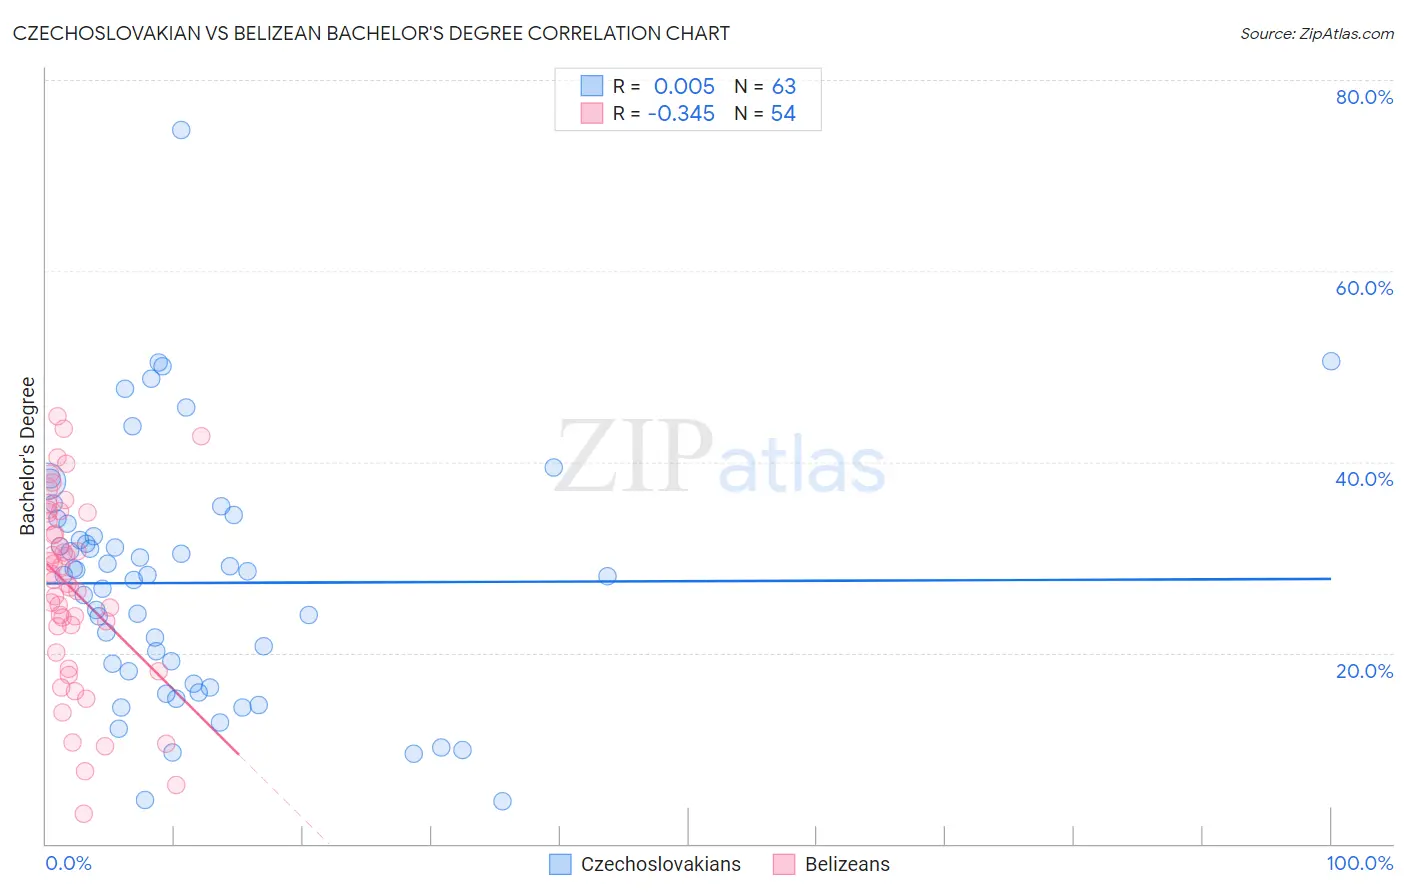
Czechoslovakian vs Belizean Bachelor's Degree Correlation Chart
The statistical analysis conducted on geographies consisting of 368,656,167 people shows no correlation between the proportion of Czechoslovakians and percentage of population with at least bachelor's degree education in the United States with a correlation coefficient (R) of 0.005 and weighted average of 37.0%. Similarly, the statistical analysis conducted on geographies consisting of 144,217,476 people shows a mild negative correlation between the proportion of Belizeans and percentage of population with at least bachelor's degree education in the United States with a correlation coefficient (R) of -0.345 and weighted average of 32.8%, a difference of 12.8%.
Bachelor's Degree Correlation Summary
| Measurement | Czechoslovakian | Belizean |
| Minimum | 4.4% | 3.1% |
| Maximum | 74.8% | 44.8% |
| Range | 70.3% | 41.6% |
| Mean | 27.3% | 26.6% |
| Median | 28.1% | 27.4% |
| Interquartile 25% (IQ1) | 16.8% | 20.1% |
| Interquartile 75% (IQ3) | 33.5% | 34.7% |
| Interquartile Range (IQR) | 16.8% | 14.6% |
| Standard Deviation (Sample) | 13.0% | 10.0% |
| Standard Deviation (Population) | 12.9% | 9.9% |
Similar Demographics by Bachelor's Degree
Demographics Similar to Czechoslovakians by Bachelor's Degree
In terms of bachelor's degree, the demographic groups most similar to Czechoslovakians are Welsh (37.0%, a difference of 0.010%), Celtic (37.0%, a difference of 0.040%), Korean (37.0%, a difference of 0.070%), Belgian (37.0%, a difference of 0.090%), and Immigrants from Costa Rica (36.9%, a difference of 0.22%).
| Demographics | Rating | Rank | Bachelor's Degree |
| Swiss | 34.1 /100 | #190 | Fair 37.2% |
| Nigerians | 33.9 /100 | #191 | Fair 37.2% |
| Immigrants | Vietnam | 32.1 /100 | #192 | Fair 37.1% |
| Yugoslavians | 31.5 /100 | #193 | Fair 37.1% |
| Belgians | 29.9 /100 | #194 | Fair 37.0% |
| Koreans | 29.8 /100 | #195 | Fair 37.0% |
| Celtics | 29.5 /100 | #196 | Fair 37.0% |
| Czechoslovakians | 29.2 /100 | #197 | Fair 37.0% |
| Welsh | 29.1 /100 | #198 | Fair 37.0% |
| Immigrants | Costa Rica | 27.4 /100 | #199 | Fair 36.9% |
| Immigrants | Ghana | 27.4 /100 | #200 | Fair 36.9% |
| Immigrants | South Eastern Asia | 25.4 /100 | #201 | Fair 36.8% |
| Immigrants | Zaire | 25.3 /100 | #202 | Fair 36.8% |
| Immigrants | Nigeria | 23.1 /100 | #203 | Fair 36.7% |
| Immigrants | Immigrants | 22.8 /100 | #204 | Fair 36.7% |
Demographics Similar to Belizeans by Bachelor's Degree
In terms of bachelor's degree, the demographic groups most similar to Belizeans are African (32.9%, a difference of 0.29%), Immigrants from Jamaica (32.9%, a difference of 0.29%), Malaysian (32.9%, a difference of 0.38%), Osage (33.0%, a difference of 0.75%), and Central American Indian (32.5%, a difference of 0.78%).
| Demographics | Rating | Rank | Bachelor's Degree |
| Nicaraguans | 0.6 /100 | #256 | Tragic 33.1% |
| Spanish Americans | 0.6 /100 | #257 | Tragic 33.1% |
| French American Indians | 0.6 /100 | #258 | Tragic 33.1% |
| Osage | 0.5 /100 | #259 | Tragic 33.0% |
| Malaysians | 0.5 /100 | #260 | Tragic 32.9% |
| Africans | 0.5 /100 | #261 | Tragic 32.9% |
| Immigrants | Jamaica | 0.5 /100 | #262 | Tragic 32.9% |
| Belizeans | 0.4 /100 | #263 | Tragic 32.8% |
| Central American Indians | 0.3 /100 | #264 | Tragic 32.5% |
| Bahamians | 0.3 /100 | #265 | Tragic 32.5% |
| Immigrants | Dominica | 0.3 /100 | #266 | Tragic 32.5% |
| Cubans | 0.3 /100 | #267 | Tragic 32.5% |
| Immigrants | Portugal | 0.2 /100 | #268 | Tragic 32.2% |
| Immigrants | Belize | 0.2 /100 | #269 | Tragic 32.1% |
| Immigrants | Nicaragua | 0.2 /100 | #270 | Tragic 31.9% |