Cypriot vs Immigrants from Uruguay Median Household Income
COMPARE
Cypriot
Immigrants from Uruguay
Median Household Income
Median Household Income Comparison
Cypriots
Immigrants from Uruguay
$102,843
MEDIAN HOUSEHOLD INCOME
100.0/ 100
METRIC RATING
18th/ 347
METRIC RANK
$82,560
MEDIAN HOUSEHOLD INCOME
16.4/ 100
METRIC RATING
210th/ 347
METRIC RANK
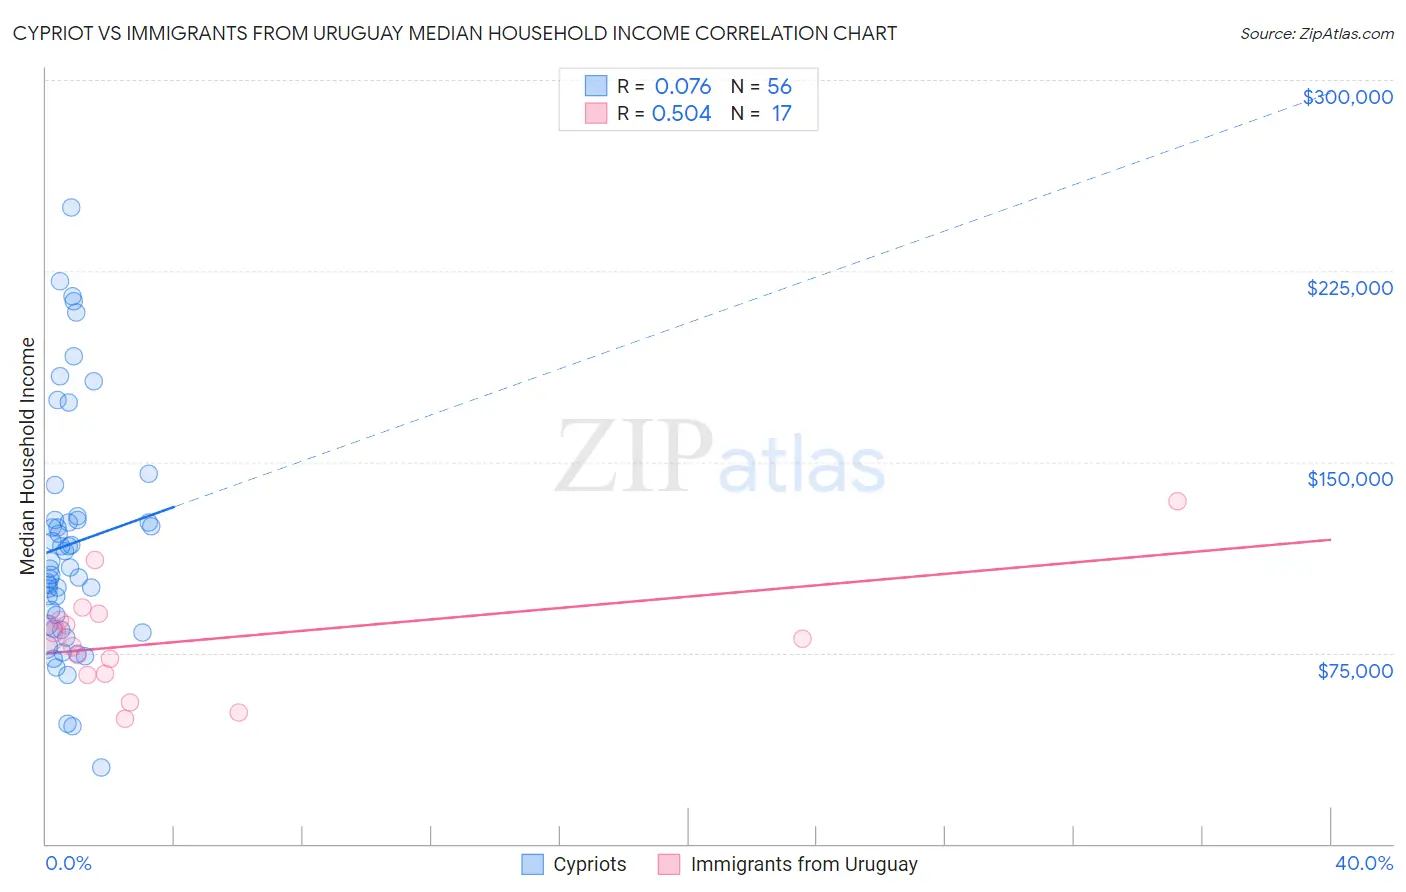
Cypriot vs Immigrants from Uruguay Median Household Income Correlation Chart
The statistical analysis conducted on geographies consisting of 61,845,026 people shows a slight positive correlation between the proportion of Cypriots and median household income in the United States with a correlation coefficient (R) of 0.076 and weighted average of $102,843. Similarly, the statistical analysis conducted on geographies consisting of 133,237,976 people shows a substantial positive correlation between the proportion of Immigrants from Uruguay and median household income in the United States with a correlation coefficient (R) of 0.504 and weighted average of $82,560, a difference of 24.6%.
Median Household Income Correlation Summary
| Measurement | Cypriot | Immigrants from Uruguay |
| Minimum | $30,029 | $49,241 |
| Maximum | $250,001 | $134,635 |
| Range | $219,972 | $85,394 |
| Mean | $117,612 | $80,181 |
| Median | $108,270 | $80,417 |
| Interquartile 25% (IQ1) | $84,969 | $66,523 |
| Interquartile 75% (IQ3) | $127,095 | $89,275 |
| Interquartile Range (IQR) | $42,126 | $22,752 |
| Standard Deviation (Sample) | $46,602 | $21,157 |
| Standard Deviation (Population) | $46,184 | $20,525 |
Similar Demographics by Median Household Income
Demographics Similar to Cypriots by Median Household Income
In terms of median household income, the demographic groups most similar to Cypriots are Immigrants from Korea ($102,962, a difference of 0.12%), Immigrants from Australia ($102,562, a difference of 0.27%), Burmese ($103,145, a difference of 0.29%), Bolivian ($102,195, a difference of 0.63%), and Eastern European ($101,781, a difference of 1.0%).
| Demographics | Rating | Rank | Median Household Income |
| Immigrants | China | 100.0 /100 | #11 | Exceptional $105,335 |
| Indians (Asian) | 100.0 /100 | #12 | Exceptional $105,262 |
| Immigrants | Eastern Asia | 100.0 /100 | #13 | Exceptional $104,796 |
| Immigrants | Ireland | 100.0 /100 | #14 | Exceptional $104,692 |
| Immigrants | Israel | 100.0 /100 | #15 | Exceptional $104,090 |
| Burmese | 100.0 /100 | #16 | Exceptional $103,145 |
| Immigrants | Korea | 100.0 /100 | #17 | Exceptional $102,962 |
| Cypriots | 100.0 /100 | #18 | Exceptional $102,843 |
| Immigrants | Australia | 100.0 /100 | #19 | Exceptional $102,562 |
| Bolivians | 100.0 /100 | #20 | Exceptional $102,195 |
| Eastern Europeans | 100.0 /100 | #21 | Exceptional $101,781 |
| Asians | 100.0 /100 | #22 | Exceptional $101,681 |
| Immigrants | Bolivia | 100.0 /100 | #23 | Exceptional $101,394 |
| Immigrants | Japan | 100.0 /100 | #24 | Exceptional $100,711 |
| Immigrants | Sweden | 100.0 /100 | #25 | Exceptional $100,699 |
Demographics Similar to Immigrants from Uruguay by Median Household Income
In terms of median household income, the demographic groups most similar to Immigrants from Uruguay are Immigrants from Iraq ($82,594, a difference of 0.040%), Salvadoran ($82,449, a difference of 0.14%), Venezuelan ($82,432, a difference of 0.16%), Nepalese ($82,410, a difference of 0.18%), and French Canadian ($82,810, a difference of 0.30%).
| Demographics | Rating | Rank | Median Household Income |
| Immigrants | Cambodia | 24.0 /100 | #203 | Fair $83,304 |
| Immigrants | Africa | 23.8 /100 | #204 | Fair $83,289 |
| Celtics | 22.7 /100 | #205 | Fair $83,193 |
| Immigrants | Kenya | 21.3 /100 | #206 | Fair $83,068 |
| Dutch | 20.3 /100 | #207 | Fair $82,971 |
| French Canadians | 18.7 /100 | #208 | Poor $82,810 |
| Immigrants | Iraq | 16.7 /100 | #209 | Poor $82,594 |
| Immigrants | Uruguay | 16.4 /100 | #210 | Poor $82,560 |
| Salvadorans | 15.4 /100 | #211 | Poor $82,449 |
| Venezuelans | 15.3 /100 | #212 | Poor $82,432 |
| Nepalese | 15.1 /100 | #213 | Poor $82,410 |
| Panamanians | 14.0 /100 | #214 | Poor $82,272 |
| Vietnamese | 13.8 /100 | #215 | Poor $82,248 |
| Yugoslavians | 13.3 /100 | #216 | Poor $82,186 |
| Ecuadorians | 12.5 /100 | #217 | Poor $82,070 |