Cypriot vs Immigrants from Guatemala Vision Disability
COMPARE
Cypriot
Immigrants from Guatemala
Vision Disability
Vision Disability Comparison
Cypriots
Immigrants from Guatemala
2.0%
VISION DISABILITY
99.7/ 100
METRIC RATING
41st/ 347
METRIC RANK
2.4%
VISION DISABILITY
0.3/ 100
METRIC RATING
255th/ 347
METRIC RANK
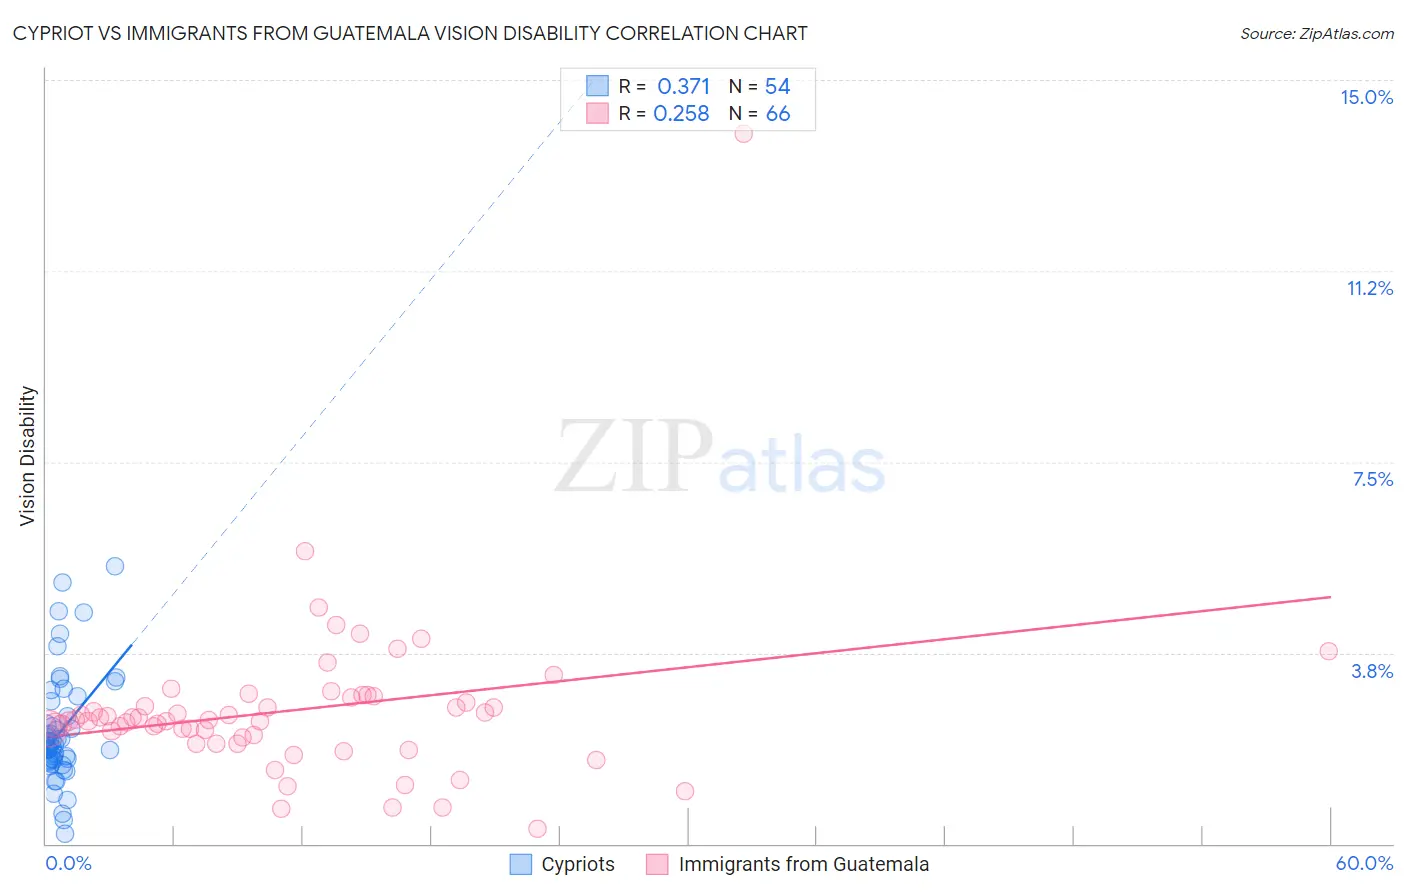
Cypriot vs Immigrants from Guatemala Vision Disability Correlation Chart
The statistical analysis conducted on geographies consisting of 61,856,516 people shows a mild positive correlation between the proportion of Cypriots and percentage of population with vision disability in the United States with a correlation coefficient (R) of 0.371 and weighted average of 2.0%. Similarly, the statistical analysis conducted on geographies consisting of 377,092,792 people shows a weak positive correlation between the proportion of Immigrants from Guatemala and percentage of population with vision disability in the United States with a correlation coefficient (R) of 0.258 and weighted average of 2.4%, a difference of 20.4%.
Vision Disability Correlation Summary
| Measurement | Cypriot | Immigrants from Guatemala |
| Minimum | 0.21% | 0.29% |
| Maximum | 5.5% | 14.0% |
| Range | 5.3% | 13.7% |
| Mean | 2.2% | 2.6% |
| Median | 1.9% | 2.4% |
| Interquartile 25% (IQ1) | 1.6% | 2.1% |
| Interquartile 75% (IQ3) | 2.8% | 2.9% |
| Interquartile Range (IQR) | 1.2% | 0.78% |
| Standard Deviation (Sample) | 1.1% | 1.7% |
| Standard Deviation (Population) | 1.1% | 1.7% |
Similar Demographics by Vision Disability
Demographics Similar to Cypriots by Vision Disability
In terms of vision disability, the demographic groups most similar to Cypriots are Immigrants from Ireland (2.0%, a difference of 0.030%), Immigrants from Ethiopia (2.0%, a difference of 0.16%), Zimbabwean (2.0%, a difference of 0.22%), Eastern European (2.0%, a difference of 0.22%), and Immigrants from Indonesia (2.0%, a difference of 0.24%).
| Demographics | Rating | Rank | Vision Disability |
| Immigrants | Turkey | 99.8 /100 | #34 | Exceptional 1.9% |
| Immigrants | Australia | 99.8 /100 | #35 | Exceptional 1.9% |
| Cambodians | 99.8 /100 | #36 | Exceptional 2.0% |
| Bhutanese | 99.8 /100 | #37 | Exceptional 2.0% |
| Immigrants | Kuwait | 99.8 /100 | #38 | Exceptional 2.0% |
| Zimbabweans | 99.7 /100 | #39 | Exceptional 2.0% |
| Immigrants | Ireland | 99.7 /100 | #40 | Exceptional 2.0% |
| Cypriots | 99.7 /100 | #41 | Exceptional 2.0% |
| Immigrants | Ethiopia | 99.7 /100 | #42 | Exceptional 2.0% |
| Eastern Europeans | 99.7 /100 | #43 | Exceptional 2.0% |
| Immigrants | Indonesia | 99.7 /100 | #44 | Exceptional 2.0% |
| Ethiopians | 99.7 /100 | #45 | Exceptional 2.0% |
| Immigrants | Sweden | 99.7 /100 | #46 | Exceptional 2.0% |
| Immigrants | Bulgaria | 99.7 /100 | #47 | Exceptional 2.0% |
| Israelis | 99.6 /100 | #48 | Exceptional 2.0% |
Demographics Similar to Immigrants from Guatemala by Vision Disability
In terms of vision disability, the demographic groups most similar to Immigrants from Guatemala are Haitian (2.4%, a difference of 0.030%), Japanese (2.4%, a difference of 0.31%), Immigrants from Haiti (2.4%, a difference of 0.33%), Immigrants from Micronesia (2.4%, a difference of 0.38%), and West Indian (2.4%, a difference of 0.40%).
| Demographics | Rating | Rank | Vision Disability |
| Sub-Saharan Africans | 0.5 /100 | #248 | Tragic 2.3% |
| Liberians | 0.5 /100 | #249 | Tragic 2.3% |
| Bangladeshis | 0.5 /100 | #250 | Tragic 2.3% |
| Immigrants | Laos | 0.4 /100 | #251 | Tragic 2.4% |
| Immigrants | Micronesia | 0.3 /100 | #252 | Tragic 2.4% |
| Japanese | 0.3 /100 | #253 | Tragic 2.4% |
| Haitians | 0.3 /100 | #254 | Tragic 2.4% |
| Immigrants | Guatemala | 0.3 /100 | #255 | Tragic 2.4% |
| Immigrants | Haiti | 0.2 /100 | #256 | Tragic 2.4% |
| West Indians | 0.2 /100 | #257 | Tragic 2.4% |
| British West Indians | 0.2 /100 | #258 | Tragic 2.4% |
| Whites/Caucasians | 0.2 /100 | #259 | Tragic 2.4% |
| Belizeans | 0.2 /100 | #260 | Tragic 2.4% |
| Fijians | 0.1 /100 | #261 | Tragic 2.4% |
| Jamaicans | 0.1 /100 | #262 | Tragic 2.4% |