Jamaican vs Immigrants from Honduras Master's Degree
COMPARE
Jamaican
Immigrants from Honduras
Master's Degree
Master's Degree Comparison
Jamaicans
Immigrants from Honduras
13.4%
MASTER'S DEGREE
4.1/ 100
METRIC RATING
237th/ 347
METRIC RANK
11.8%
MASTER'S DEGREE
0.1/ 100
METRIC RATING
288th/ 347
METRIC RANK
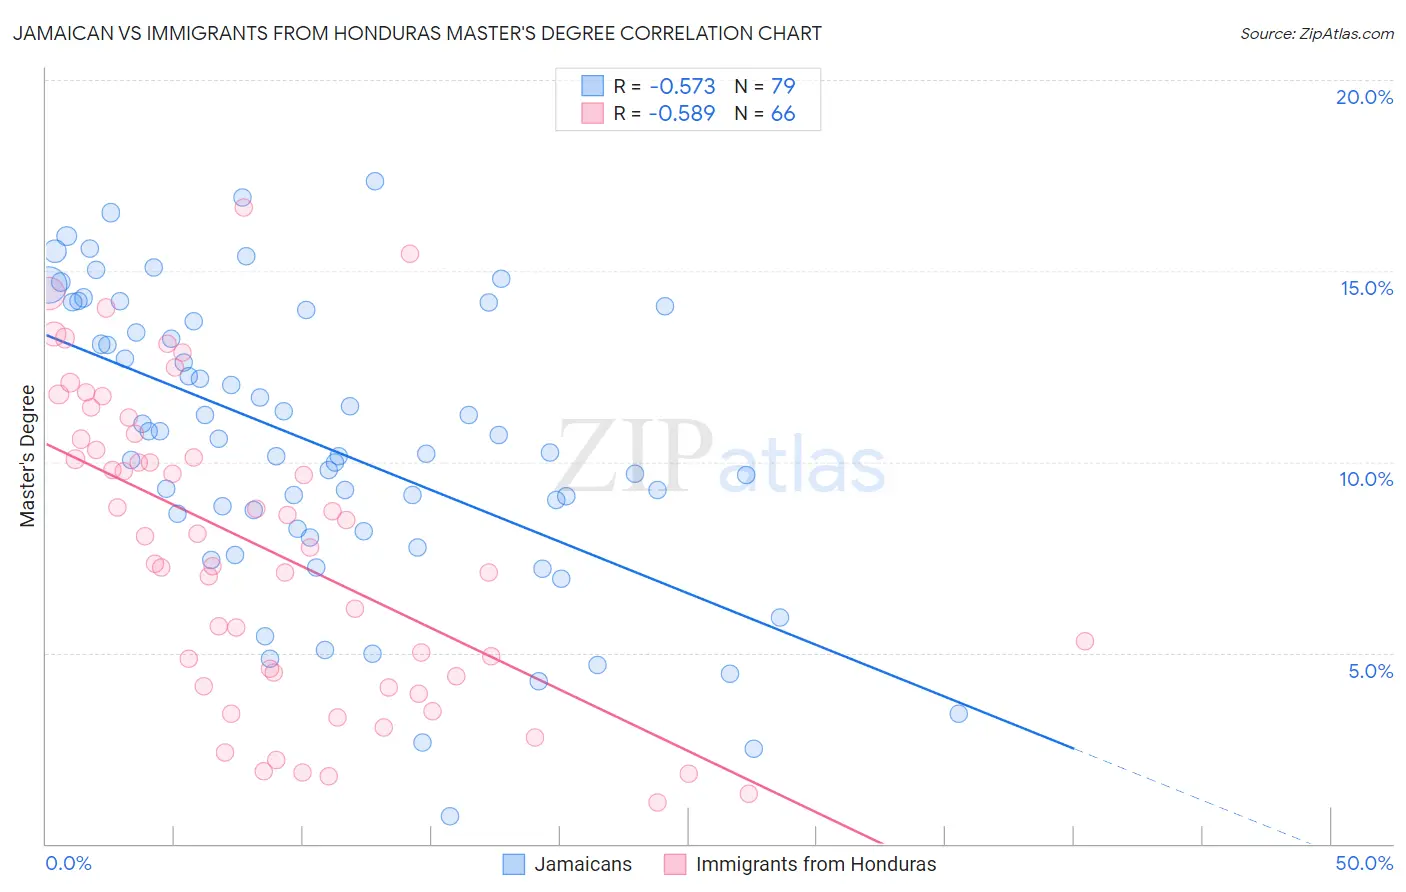
Jamaican vs Immigrants from Honduras Master's Degree Correlation Chart
The statistical analysis conducted on geographies consisting of 367,857,102 people shows a substantial negative correlation between the proportion of Jamaicans and percentage of population with at least master's degree education in the United States with a correlation coefficient (R) of -0.573 and weighted average of 13.4%. Similarly, the statistical analysis conducted on geographies consisting of 322,506,731 people shows a substantial negative correlation between the proportion of Immigrants from Honduras and percentage of population with at least master's degree education in the United States with a correlation coefficient (R) of -0.589 and weighted average of 11.8%, a difference of 14.1%.
Master's Degree Correlation Summary
| Measurement | Jamaican | Immigrants from Honduras |
| Minimum | 0.72% | 1.1% |
| Maximum | 17.3% | 16.7% |
| Range | 16.6% | 15.6% |
| Mean | 10.4% | 7.7% |
| Median | 10.2% | 7.9% |
| Interquartile 25% (IQ1) | 8.2% | 4.4% |
| Interquartile 75% (IQ3) | 13.7% | 10.6% |
| Interquartile Range (IQR) | 5.5% | 6.2% |
| Standard Deviation (Sample) | 3.8% | 4.0% |
| Standard Deviation (Population) | 3.7% | 3.9% |
Similar Demographics by Master's Degree
Demographics Similar to Jamaicans by Master's Degree
In terms of master's degree, the demographic groups most similar to Jamaicans are Hmong (13.4%, a difference of 0.14%), Immigrants from Guyana (13.4%, a difference of 0.22%), German Russian (13.5%, a difference of 0.34%), Nonimmigrants (13.3%, a difference of 0.67%), and Immigrants from Burma/Myanmar (13.5%, a difference of 0.75%).
| Demographics | Rating | Rank | Master's Degree |
| Dutch | 8.7 /100 | #230 | Tragic 13.8% |
| Guyanese | 7.6 /100 | #231 | Tragic 13.7% |
| Immigrants | Philippines | 6.0 /100 | #232 | Tragic 13.6% |
| Immigrants | Ecuador | 5.7 /100 | #233 | Tragic 13.6% |
| Immigrants | Burma/Myanmar | 5.0 /100 | #234 | Tragic 13.5% |
| German Russians | 4.5 /100 | #235 | Tragic 13.5% |
| Immigrants | Guyana | 4.4 /100 | #236 | Tragic 13.4% |
| Jamaicans | 4.1 /100 | #237 | Tragic 13.4% |
| Hmong | 4.0 /100 | #238 | Tragic 13.4% |
| Immigrants | Nonimmigrants | 3.4 /100 | #239 | Tragic 13.3% |
| Guamanians/Chamorros | 2.2 /100 | #240 | Tragic 13.1% |
| U.S. Virgin Islanders | 2.1 /100 | #241 | Tragic 13.1% |
| Spanish Americans | 1.9 /100 | #242 | Tragic 13.0% |
| Immigrants | Jamaica | 1.9 /100 | #243 | Tragic 13.0% |
| Delaware | 1.7 /100 | #244 | Tragic 13.0% |
Demographics Similar to Immigrants from Honduras by Master's Degree
In terms of master's degree, the demographic groups most similar to Immigrants from Honduras are Guatemalan (11.7%, a difference of 0.080%), Immigrants from Haiti (11.8%, a difference of 0.17%), Ute (11.7%, a difference of 0.32%), Aleut (11.8%, a difference of 0.36%), and Immigrants from Nicaragua (11.8%, a difference of 0.72%).
| Demographics | Rating | Rank | Master's Degree |
| Malaysians | 0.2 /100 | #281 | Tragic 12.0% |
| Immigrants | El Salvador | 0.2 /100 | #282 | Tragic 12.0% |
| Hondurans | 0.2 /100 | #283 | Tragic 11.9% |
| Ottawa | 0.2 /100 | #284 | Tragic 11.9% |
| Immigrants | Nicaragua | 0.2 /100 | #285 | Tragic 11.8% |
| Aleuts | 0.1 /100 | #286 | Tragic 11.8% |
| Immigrants | Haiti | 0.1 /100 | #287 | Tragic 11.8% |
| Immigrants | Honduras | 0.1 /100 | #288 | Tragic 11.8% |
| Guatemalans | 0.1 /100 | #289 | Tragic 11.7% |
| Ute | 0.1 /100 | #290 | Tragic 11.7% |
| Colville | 0.1 /100 | #291 | Tragic 11.6% |
| Immigrants | Guatemala | 0.1 /100 | #292 | Tragic 11.6% |
| Alaska Natives | 0.1 /100 | #293 | Tragic 11.6% |
| Hawaiians | 0.1 /100 | #294 | Tragic 11.6% |
| Marshallese | 0.1 /100 | #295 | Tragic 11.6% |