Puget Sound Salish vs Nigerian College, 1 year or more
COMPARE
Puget Sound Salish
Nigerian
College, 1 year or more
College, 1 year or more Comparison
Puget Sound Salish
Nigerians
55.9%
COLLEGE, 1 YEAR OR MORE
1.1/ 100
METRIC RATING
239th/ 347
METRIC RANK
58.5%
COLLEGE, 1 YEAR OR MORE
23.0/ 100
METRIC RATING
201st/ 347
METRIC RANK
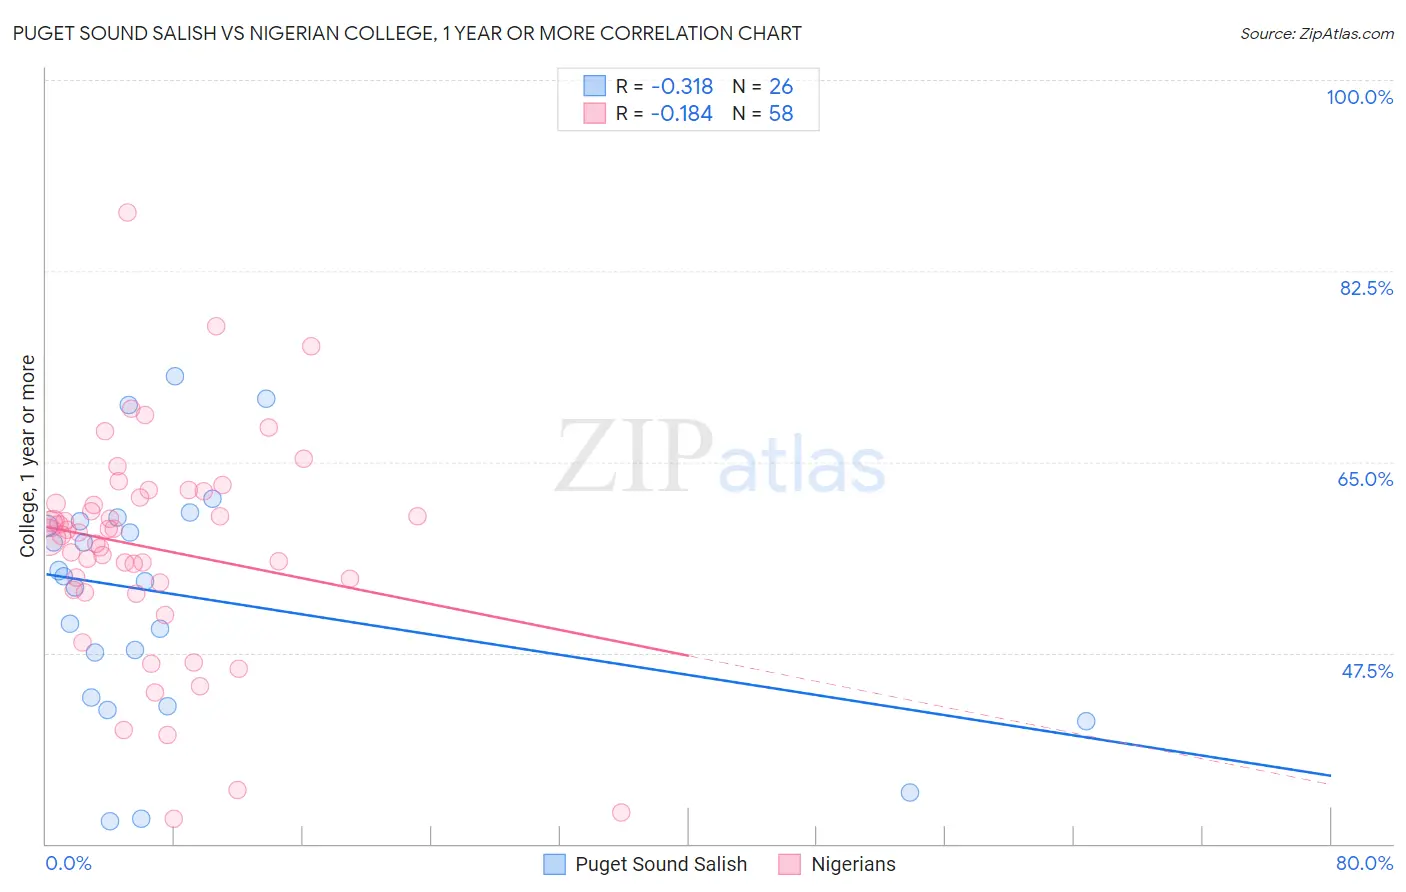
Puget Sound Salish vs Nigerian College, 1 year or more Correlation Chart
The statistical analysis conducted on geographies consisting of 46,155,865 people shows a mild negative correlation between the proportion of Puget Sound Salish and percentage of population with at least college, 1 year or more education in the United States with a correlation coefficient (R) of -0.318 and weighted average of 55.9%. Similarly, the statistical analysis conducted on geographies consisting of 332,779,766 people shows a poor negative correlation between the proportion of Nigerians and percentage of population with at least college, 1 year or more education in the United States with a correlation coefficient (R) of -0.184 and weighted average of 58.5%, a difference of 4.6%.
College, 1 year or more Correlation Summary
| Measurement | Puget Sound Salish | Nigerian |
| Minimum | 32.1% | 32.3% |
| Maximum | 72.9% | 87.8% |
| Range | 40.8% | 55.5% |
| Mean | 52.7% | 57.1% |
| Median | 54.3% | 58.4% |
| Interquartile 25% (IQ1) | 43.4% | 53.2% |
| Interquartile 75% (IQ3) | 59.6% | 61.7% |
| Interquartile Range (IQR) | 16.2% | 8.5% |
| Standard Deviation (Sample) | 11.1% | 10.1% |
| Standard Deviation (Population) | 10.9% | 10.0% |
Similar Demographics by College, 1 year or more
Demographics Similar to Puget Sound Salish by College, 1 year or more
In terms of college, 1 year or more, the demographic groups most similar to Puget Sound Salish are Trinidadian and Tobagonian (55.8%, a difference of 0.090%), French American Indian (55.8%, a difference of 0.14%), Barbadian (56.0%, a difference of 0.20%), Marshallese (55.8%, a difference of 0.25%), and Osage (55.8%, a difference of 0.26%).
| Demographics | Rating | Rank | College, 1 year or more |
| Immigrants | Bangladesh | 2.6 /100 | #232 | Tragic 56.6% |
| Immigrants | Nonimmigrants | 2.5 /100 | #233 | Tragic 56.5% |
| Spanish Americans | 1.8 /100 | #234 | Tragic 56.3% |
| West Indians | 1.8 /100 | #235 | Tragic 56.3% |
| Iroquois | 1.7 /100 | #236 | Tragic 56.2% |
| Samoans | 1.6 /100 | #237 | Tragic 56.2% |
| Barbadians | 1.3 /100 | #238 | Tragic 56.0% |
| Puget Sound Salish | 1.1 /100 | #239 | Tragic 55.9% |
| Trinidadians and Tobagonians | 1.1 /100 | #240 | Tragic 55.8% |
| French American Indians | 1.0 /100 | #241 | Tragic 55.8% |
| Marshallese | 1.0 /100 | #242 | Tragic 55.8% |
| Osage | 1.0 /100 | #243 | Tragic 55.8% |
| Chippewa | 0.9 /100 | #244 | Tragic 55.7% |
| Immigrants | Liberia | 0.8 /100 | #245 | Tragic 55.7% |
| Malaysians | 0.8 /100 | #246 | Tragic 55.6% |
Demographics Similar to Nigerians by College, 1 year or more
In terms of college, 1 year or more, the demographic groups most similar to Nigerians are Immigrants from South America (58.4%, a difference of 0.080%), Spanish (58.5%, a difference of 0.090%), Slovak (58.5%, a difference of 0.12%), Immigrants from South Eastern Asia (58.5%, a difference of 0.15%), and Ghanaian (58.4%, a difference of 0.17%).
| Demographics | Rating | Rank | College, 1 year or more |
| Costa Ricans | 26.4 /100 | #194 | Fair 58.6% |
| Dutch | 26.2 /100 | #195 | Fair 58.6% |
| Guamanians/Chamorros | 26.2 /100 | #196 | Fair 58.6% |
| Immigrants | Thailand | 26.0 /100 | #197 | Fair 58.6% |
| Immigrants | South Eastern Asia | 25.1 /100 | #198 | Fair 58.5% |
| Slovaks | 24.6 /100 | #199 | Fair 58.5% |
| Spanish | 24.2 /100 | #200 | Fair 58.5% |
| Nigerians | 23.0 /100 | #201 | Fair 58.5% |
| Immigrants | South America | 21.9 /100 | #202 | Fair 58.4% |
| Ghanaians | 20.9 /100 | #203 | Fair 58.4% |
| Panamanians | 19.2 /100 | #204 | Poor 58.3% |
| Immigrants | Zaire | 18.7 /100 | #205 | Poor 58.3% |
| Immigrants | Vietnam | 18.2 /100 | #206 | Poor 58.2% |
| Senegalese | 16.9 /100 | #207 | Poor 58.2% |
| Immigrants | Uruguay | 15.2 /100 | #208 | Poor 58.1% |