Bulgarian vs Nigerian College, 1 year or more
COMPARE
Bulgarian
Nigerian
College, 1 year or more
College, 1 year or more Comparison
Bulgarians
Nigerians
65.5%
COLLEGE, 1 YEAR OR MORE
100.0/ 100
METRIC RATING
32nd/ 347
METRIC RANK
58.5%
COLLEGE, 1 YEAR OR MORE
23.0/ 100
METRIC RATING
201st/ 347
METRIC RANK
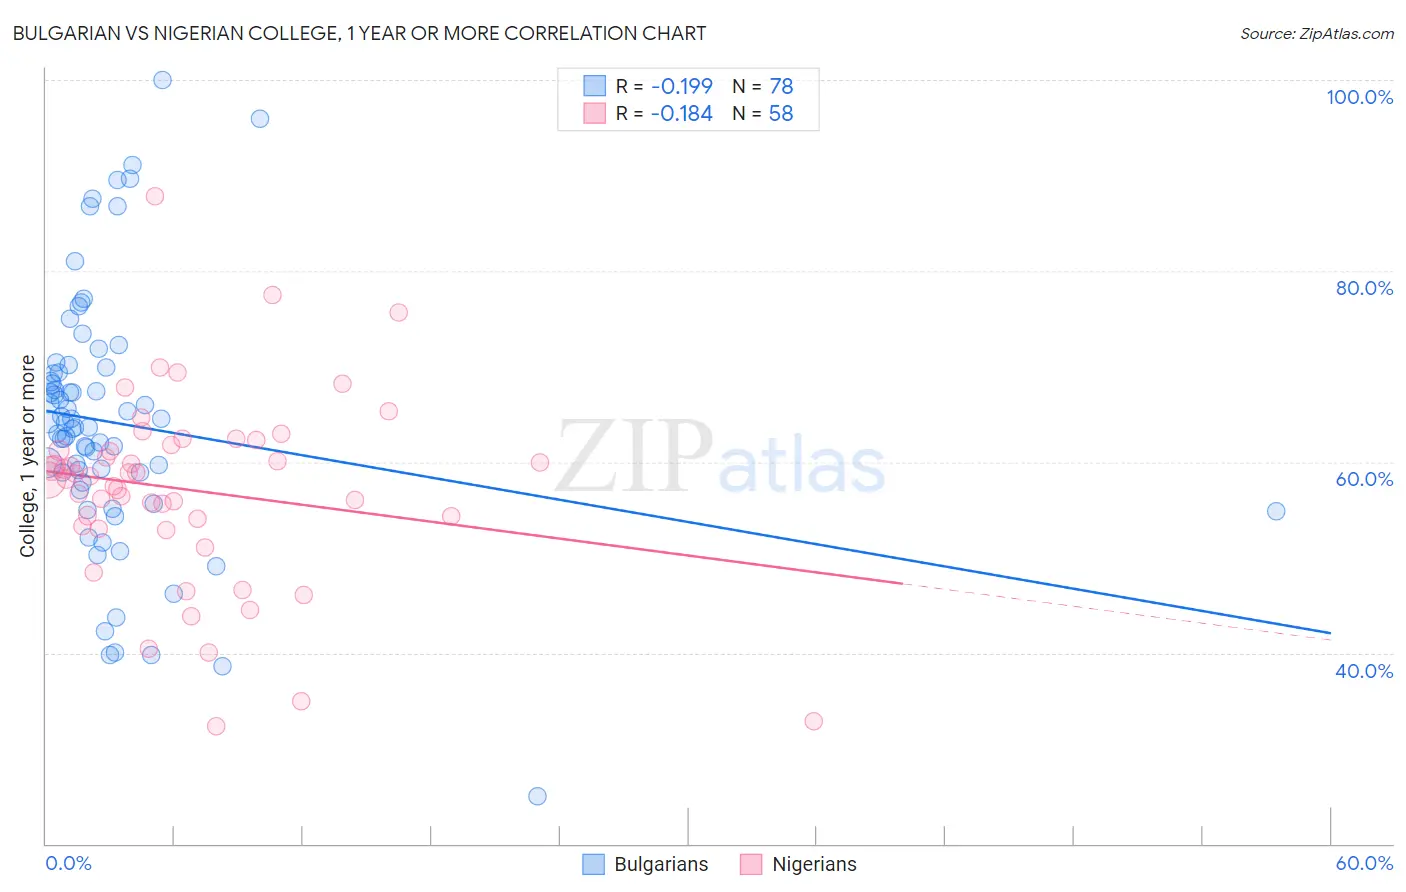
Bulgarian vs Nigerian College, 1 year or more Correlation Chart
The statistical analysis conducted on geographies consisting of 205,631,725 people shows a poor negative correlation between the proportion of Bulgarians and percentage of population with at least college, 1 year or more education in the United States with a correlation coefficient (R) of -0.199 and weighted average of 65.5%. Similarly, the statistical analysis conducted on geographies consisting of 332,779,766 people shows a poor negative correlation between the proportion of Nigerians and percentage of population with at least college, 1 year or more education in the United States with a correlation coefficient (R) of -0.184 and weighted average of 58.5%, a difference of 12.0%.
College, 1 year or more Correlation Summary
| Measurement | Bulgarian | Nigerian |
| Minimum | 25.0% | 32.3% |
| Maximum | 100.0% | 87.8% |
| Range | 75.0% | 55.5% |
| Mean | 64.0% | 57.1% |
| Median | 63.9% | 58.4% |
| Interquartile 25% (IQ1) | 57.8% | 53.2% |
| Interquartile 75% (IQ3) | 69.4% | 61.7% |
| Interquartile Range (IQR) | 11.5% | 8.5% |
| Standard Deviation (Sample) | 13.5% | 10.1% |
| Standard Deviation (Population) | 13.4% | 10.0% |
Similar Demographics by College, 1 year or more
Demographics Similar to Bulgarians by College, 1 year or more
In terms of college, 1 year or more, the demographic groups most similar to Bulgarians are Turkish (65.5%, a difference of 0.050%), Immigrants from Denmark (65.6%, a difference of 0.13%), Immigrants from Sri Lanka (65.4%, a difference of 0.15%), Immigrants from Northern Europe (65.6%, a difference of 0.24%), and Israeli (65.3%, a difference of 0.27%).
| Demographics | Rating | Rank | College, 1 year or more |
| Indians (Asian) | 100.0 /100 | #25 | Exceptional 66.1% |
| Latvians | 100.0 /100 | #26 | Exceptional 66.1% |
| Immigrants | Ireland | 100.0 /100 | #27 | Exceptional 65.9% |
| Immigrants | France | 100.0 /100 | #28 | Exceptional 65.8% |
| Immigrants | Northern Europe | 100.0 /100 | #29 | Exceptional 65.6% |
| Immigrants | Denmark | 100.0 /100 | #30 | Exceptional 65.6% |
| Turks | 100.0 /100 | #31 | Exceptional 65.5% |
| Bulgarians | 100.0 /100 | #32 | Exceptional 65.5% |
| Immigrants | Sri Lanka | 99.9 /100 | #33 | Exceptional 65.4% |
| Israelis | 99.9 /100 | #34 | Exceptional 65.3% |
| Immigrants | Turkey | 99.9 /100 | #35 | Exceptional 65.2% |
| Immigrants | South Africa | 99.9 /100 | #36 | Exceptional 65.1% |
| Russians | 99.9 /100 | #37 | Exceptional 65.1% |
| Immigrants | Saudi Arabia | 99.9 /100 | #38 | Exceptional 65.0% |
| Estonians | 99.9 /100 | #39 | Exceptional 65.0% |
Demographics Similar to Nigerians by College, 1 year or more
In terms of college, 1 year or more, the demographic groups most similar to Nigerians are Immigrants from South America (58.4%, a difference of 0.080%), Spanish (58.5%, a difference of 0.090%), Slovak (58.5%, a difference of 0.12%), Immigrants from South Eastern Asia (58.5%, a difference of 0.15%), and Ghanaian (58.4%, a difference of 0.17%).
| Demographics | Rating | Rank | College, 1 year or more |
| Costa Ricans | 26.4 /100 | #194 | Fair 58.6% |
| Dutch | 26.2 /100 | #195 | Fair 58.6% |
| Guamanians/Chamorros | 26.2 /100 | #196 | Fair 58.6% |
| Immigrants | Thailand | 26.0 /100 | #197 | Fair 58.6% |
| Immigrants | South Eastern Asia | 25.1 /100 | #198 | Fair 58.5% |
| Slovaks | 24.6 /100 | #199 | Fair 58.5% |
| Spanish | 24.2 /100 | #200 | Fair 58.5% |
| Nigerians | 23.0 /100 | #201 | Fair 58.5% |
| Immigrants | South America | 21.9 /100 | #202 | Fair 58.4% |
| Ghanaians | 20.9 /100 | #203 | Fair 58.4% |
| Panamanians | 19.2 /100 | #204 | Poor 58.3% |
| Immigrants | Zaire | 18.7 /100 | #205 | Poor 58.3% |
| Immigrants | Vietnam | 18.2 /100 | #206 | Poor 58.2% |
| Senegalese | 16.9 /100 | #207 | Poor 58.2% |
| Immigrants | Uruguay | 15.2 /100 | #208 | Poor 58.1% |