Native/Alaskan vs Latvian College, 1 year or more
COMPARE
Native/Alaskan
Latvian
College, 1 year or more
College, 1 year or more Comparison
Natives/Alaskans
Latvians
50.2%
COLLEGE, 1 YEAR OR MORE
0.0/ 100
METRIC RATING
330th/ 347
METRIC RANK
66.1%
COLLEGE, 1 YEAR OR MORE
100.0/ 100
METRIC RATING
26th/ 347
METRIC RANK
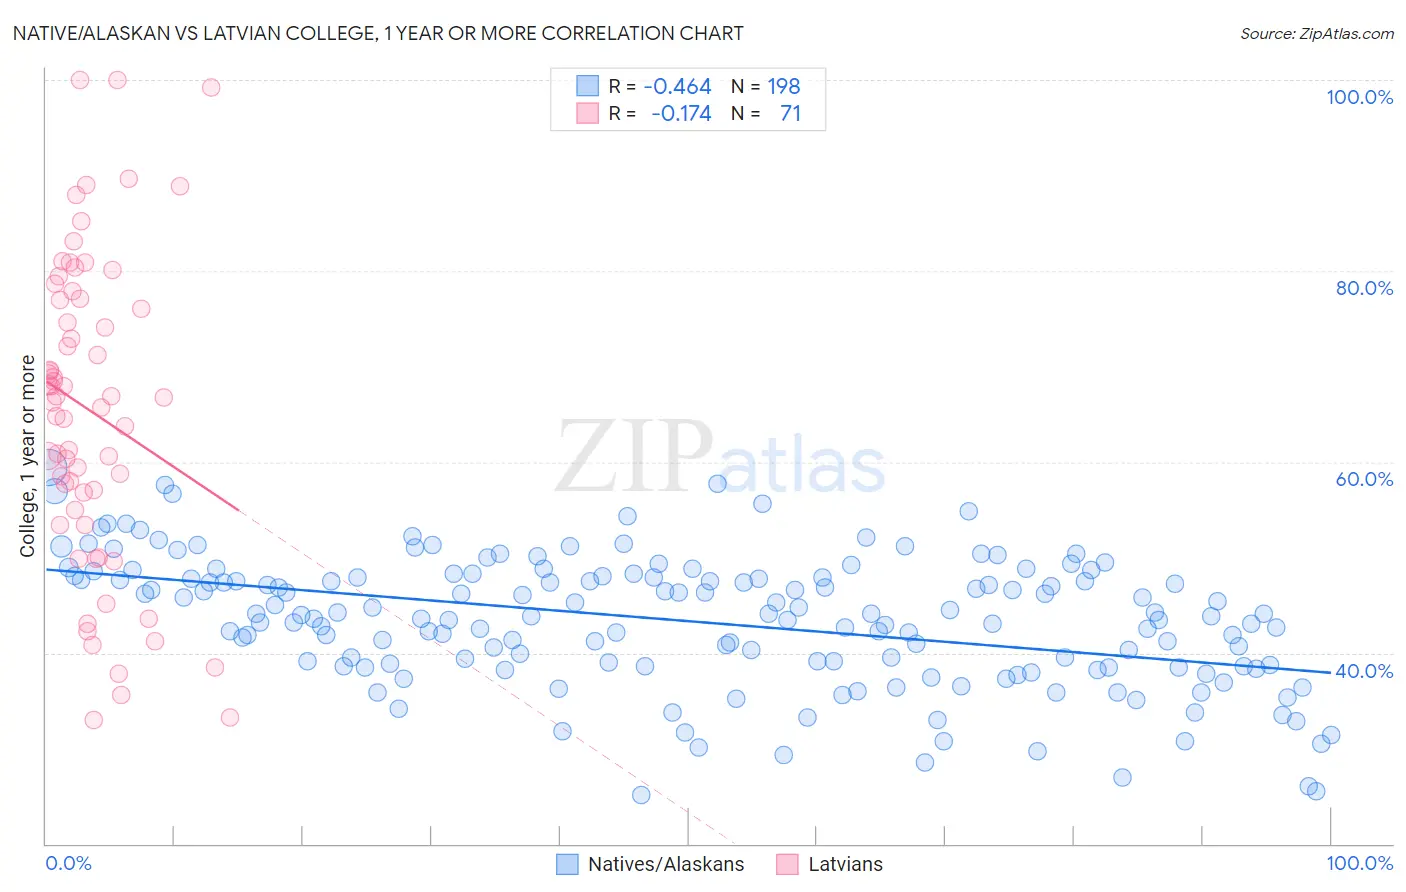
Native/Alaskan vs Latvian College, 1 year or more Correlation Chart
The statistical analysis conducted on geographies consisting of 513,066,104 people shows a moderate negative correlation between the proportion of Natives/Alaskans and percentage of population with at least college, 1 year or more education in the United States with a correlation coefficient (R) of -0.464 and weighted average of 50.2%. Similarly, the statistical analysis conducted on geographies consisting of 220,726,880 people shows a poor negative correlation between the proportion of Latvians and percentage of population with at least college, 1 year or more education in the United States with a correlation coefficient (R) of -0.174 and weighted average of 66.1%, a difference of 31.6%.
College, 1 year or more Correlation Summary
| Measurement | Native/Alaskan | Latvian |
| Minimum | 25.1% | 32.9% |
| Maximum | 59.4% | 100.0% |
| Range | 34.4% | 67.1% |
| Mean | 43.3% | 65.3% |
| Median | 43.9% | 66.8% |
| Interquartile 25% (IQ1) | 38.6% | 54.9% |
| Interquartile 75% (IQ3) | 47.9% | 77.1% |
| Interquartile Range (IQR) | 9.2% | 22.1% |
| Standard Deviation (Sample) | 6.8% | 16.2% |
| Standard Deviation (Population) | 6.8% | 16.1% |
Similar Demographics by College, 1 year or more
Demographics Similar to Natives/Alaskans by College, 1 year or more
In terms of college, 1 year or more, the demographic groups most similar to Natives/Alaskans are Cape Verdean (50.3%, a difference of 0.22%), Immigrants from Yemen (50.0%, a difference of 0.35%), Dutch West Indian (50.5%, a difference of 0.62%), Menominee (50.6%, a difference of 0.74%), and Dominican (50.6%, a difference of 0.77%).
| Demographics | Rating | Rank | College, 1 year or more |
| Immigrants | Guatemala | 0.0 /100 | #323 | Tragic 50.7% |
| Immigrants | Cuba | 0.0 /100 | #324 | Tragic 50.7% |
| Immigrants | Latin America | 0.0 /100 | #325 | Tragic 50.7% |
| Dominicans | 0.0 /100 | #326 | Tragic 50.6% |
| Menominee | 0.0 /100 | #327 | Tragic 50.6% |
| Dutch West Indians | 0.0 /100 | #328 | Tragic 50.5% |
| Cape Verdeans | 0.0 /100 | #329 | Tragic 50.3% |
| Natives/Alaskans | 0.0 /100 | #330 | Tragic 50.2% |
| Immigrants | Yemen | 0.0 /100 | #331 | Tragic 50.0% |
| Mexicans | 0.0 /100 | #332 | Tragic 49.2% |
| Immigrants | Dominican Republic | 0.0 /100 | #333 | Tragic 49.1% |
| Lumbee | 0.0 /100 | #334 | Tragic 48.9% |
| Yuman | 0.0 /100 | #335 | Tragic 48.7% |
| Spanish American Indians | 0.0 /100 | #336 | Tragic 48.5% |
| Pennsylvania Germans | 0.0 /100 | #337 | Tragic 48.5% |
Demographics Similar to Latvians by College, 1 year or more
In terms of college, 1 year or more, the demographic groups most similar to Latvians are Indian (Asian) (66.1%, a difference of 0.040%), Immigrants from Ireland (65.9%, a difference of 0.20%), Immigrants from France (65.8%, a difference of 0.37%), Immigrants from Belgium (66.3%, a difference of 0.39%), and Immigrants from China (66.4%, a difference of 0.47%).
| Demographics | Rating | Rank | College, 1 year or more |
| Immigrants | Switzerland | 100.0 /100 | #19 | Exceptional 66.5% |
| Immigrants | Korea | 100.0 /100 | #20 | Exceptional 66.5% |
| Immigrants | Hong Kong | 100.0 /100 | #21 | Exceptional 66.4% |
| Soviet Union | 100.0 /100 | #22 | Exceptional 66.4% |
| Immigrants | China | 100.0 /100 | #23 | Exceptional 66.4% |
| Immigrants | Belgium | 100.0 /100 | #24 | Exceptional 66.3% |
| Indians (Asian) | 100.0 /100 | #25 | Exceptional 66.1% |
| Latvians | 100.0 /100 | #26 | Exceptional 66.1% |
| Immigrants | Ireland | 100.0 /100 | #27 | Exceptional 65.9% |
| Immigrants | France | 100.0 /100 | #28 | Exceptional 65.8% |
| Immigrants | Northern Europe | 100.0 /100 | #29 | Exceptional 65.6% |
| Immigrants | Denmark | 100.0 /100 | #30 | Exceptional 65.6% |
| Turks | 100.0 /100 | #31 | Exceptional 65.5% |
| Bulgarians | 100.0 /100 | #32 | Exceptional 65.5% |
| Immigrants | Sri Lanka | 99.9 /100 | #33 | Exceptional 65.4% |