Creek vs Marshallese High School Diploma
COMPARE
Creek
Marshallese
High School Diploma
High School Diploma Comparison
Creek
Marshallese
88.3%
HIGH SCHOOL DIPLOMA
6.9/ 100
METRIC RATING
225th/ 347
METRIC RANK
88.6%
HIGH SCHOOL DIPLOMA
18.7/ 100
METRIC RATING
199th/ 347
METRIC RANK
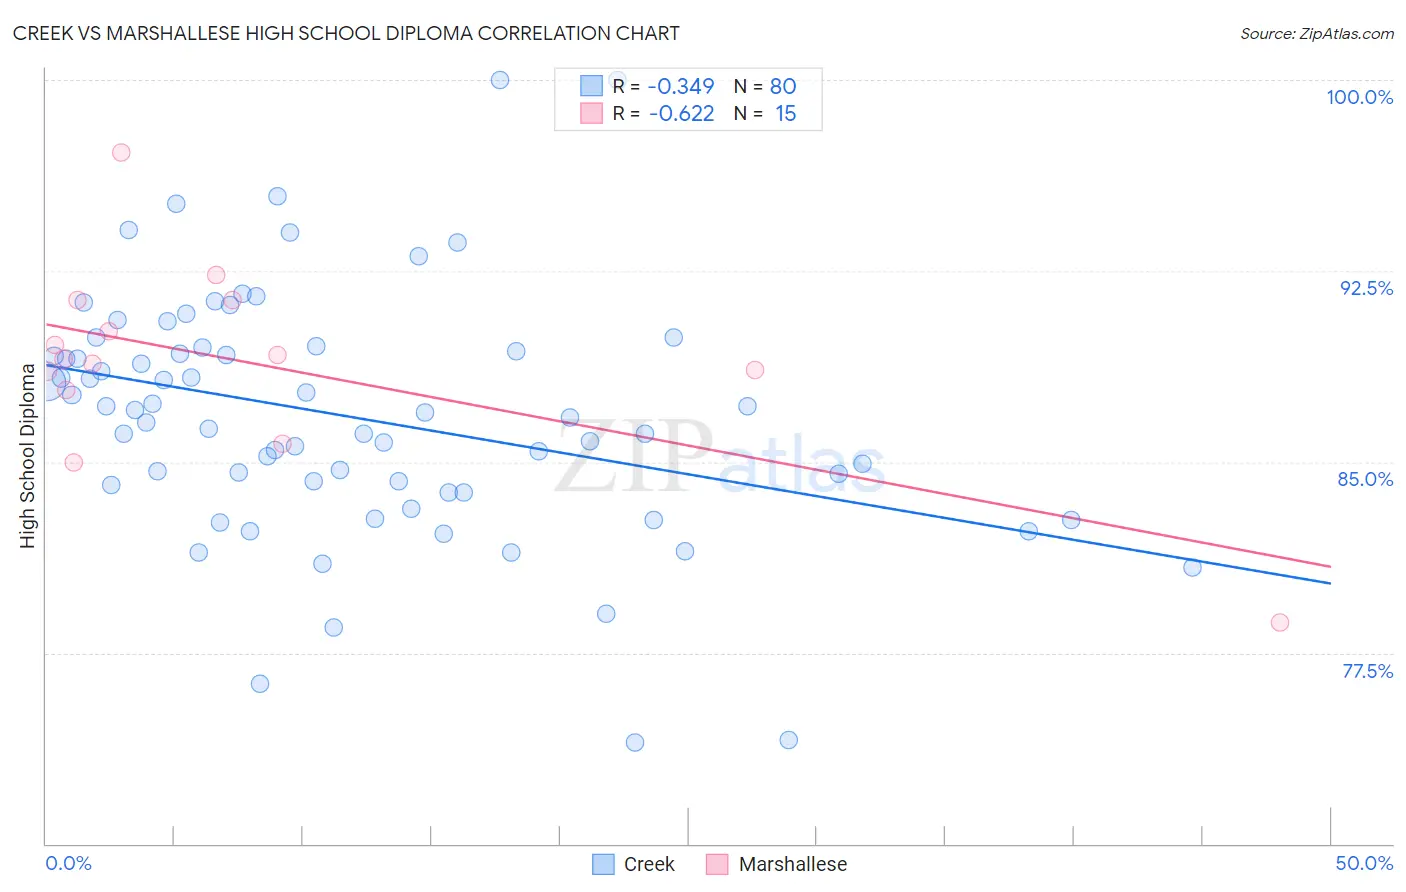
Creek vs Marshallese High School Diploma Correlation Chart
The statistical analysis conducted on geographies consisting of 178,480,629 people shows a mild negative correlation between the proportion of Creek and percentage of population with at least high school diploma education in the United States with a correlation coefficient (R) of -0.349 and weighted average of 88.3%. Similarly, the statistical analysis conducted on geographies consisting of 14,760,991 people shows a significant negative correlation between the proportion of Marshallese and percentage of population with at least high school diploma education in the United States with a correlation coefficient (R) of -0.622 and weighted average of 88.6%, a difference of 0.43%.
High School Diploma Correlation Summary
| Measurement | Creek | Marshallese |
| Minimum | 74.0% | 78.7% |
| Maximum | 100.0% | 97.2% |
| Range | 26.0% | 18.5% |
| Mean | 86.8% | 88.9% |
| Median | 86.8% | 89.0% |
| Interquartile 25% (IQ1) | 83.9% | 87.8% |
| Interquartile 75% (IQ3) | 89.4% | 91.3% |
| Interquartile Range (IQR) | 5.5% | 3.5% |
| Standard Deviation (Sample) | 4.8% | 4.0% |
| Standard Deviation (Population) | 4.8% | 3.9% |
Similar Demographics by High School Diploma
Demographics Similar to Creek by High School Diploma
In terms of high school diploma, the demographic groups most similar to Creek are Shoshone (88.3%, a difference of 0.010%), Immigrants from Zaire (88.3%, a difference of 0.040%), Colville (88.3%, a difference of 0.050%), Uruguayan (88.2%, a difference of 0.080%), and Immigrants from Afghanistan (88.3%, a difference of 0.090%).
| Demographics | Rating | Rank | High School Diploma |
| Immigrants | Bolivia | 10.3 /100 | #218 | Poor 88.4% |
| Costa Ricans | 9.6 /100 | #219 | Tragic 88.4% |
| Tongans | 9.5 /100 | #220 | Tragic 88.4% |
| Immigrants | Afghanistan | 8.6 /100 | #221 | Tragic 88.3% |
| Colville | 7.8 /100 | #222 | Tragic 88.3% |
| Immigrants | Zaire | 7.6 /100 | #223 | Tragic 88.3% |
| Shoshone | 7.0 /100 | #224 | Tragic 88.3% |
| Creek | 6.9 /100 | #225 | Tragic 88.3% |
| Uruguayans | 5.6 /100 | #226 | Tragic 88.2% |
| Immigrants | Liberia | 5.5 /100 | #227 | Tragic 88.2% |
| Kiowa | 5.3 /100 | #228 | Tragic 88.2% |
| Nigerians | 5.2 /100 | #229 | Tragic 88.2% |
| Blackfeet | 4.2 /100 | #230 | Tragic 88.1% |
| Colombians | 3.8 /100 | #231 | Tragic 88.1% |
| Immigrants | Middle Africa | 3.4 /100 | #232 | Tragic 88.0% |
Demographics Similar to Marshallese by High School Diploma
In terms of high school diploma, the demographic groups most similar to Marshallese are Liberian (88.7%, a difference of 0.0%), Hawaiian (88.6%, a difference of 0.010%), Korean (88.6%, a difference of 0.010%), Panamanian (88.6%, a difference of 0.020%), and Somali (88.6%, a difference of 0.030%).
| Demographics | Rating | Rank | High School Diploma |
| Moroccans | 29.5 /100 | #192 | Fair 88.8% |
| Immigrants | Oceania | 26.9 /100 | #193 | Fair 88.8% |
| Immigrants | Venezuela | 25.8 /100 | #194 | Fair 88.8% |
| Afghans | 23.9 /100 | #195 | Fair 88.8% |
| Immigrants | Southern Europe | 23.4 /100 | #196 | Fair 88.7% |
| French American Indians | 21.5 /100 | #197 | Fair 88.7% |
| Liberians | 18.8 /100 | #198 | Poor 88.7% |
| Marshallese | 18.7 /100 | #199 | Poor 88.6% |
| Hawaiians | 18.3 /100 | #200 | Poor 88.6% |
| Koreans | 18.1 /100 | #201 | Poor 88.6% |
| Panamanians | 18.0 /100 | #202 | Poor 88.6% |
| Somalis | 17.5 /100 | #203 | Poor 88.6% |
| Armenians | 17.2 /100 | #204 | Poor 88.6% |
| Immigrants | Micronesia | 16.4 /100 | #205 | Poor 88.6% |
| Arapaho | 16.1 /100 | #206 | Poor 88.6% |