Creek vs Menominee High School Diploma
COMPARE
Creek
Menominee
High School Diploma
High School Diploma Comparison
Creek
Menominee
88.3%
HIGH SCHOOL DIPLOMA
6.9/ 100
METRIC RATING
225th/ 347
METRIC RANK
90.3%
HIGH SCHOOL DIPLOMA
96.6/ 100
METRIC RATING
111th/ 347
METRIC RANK
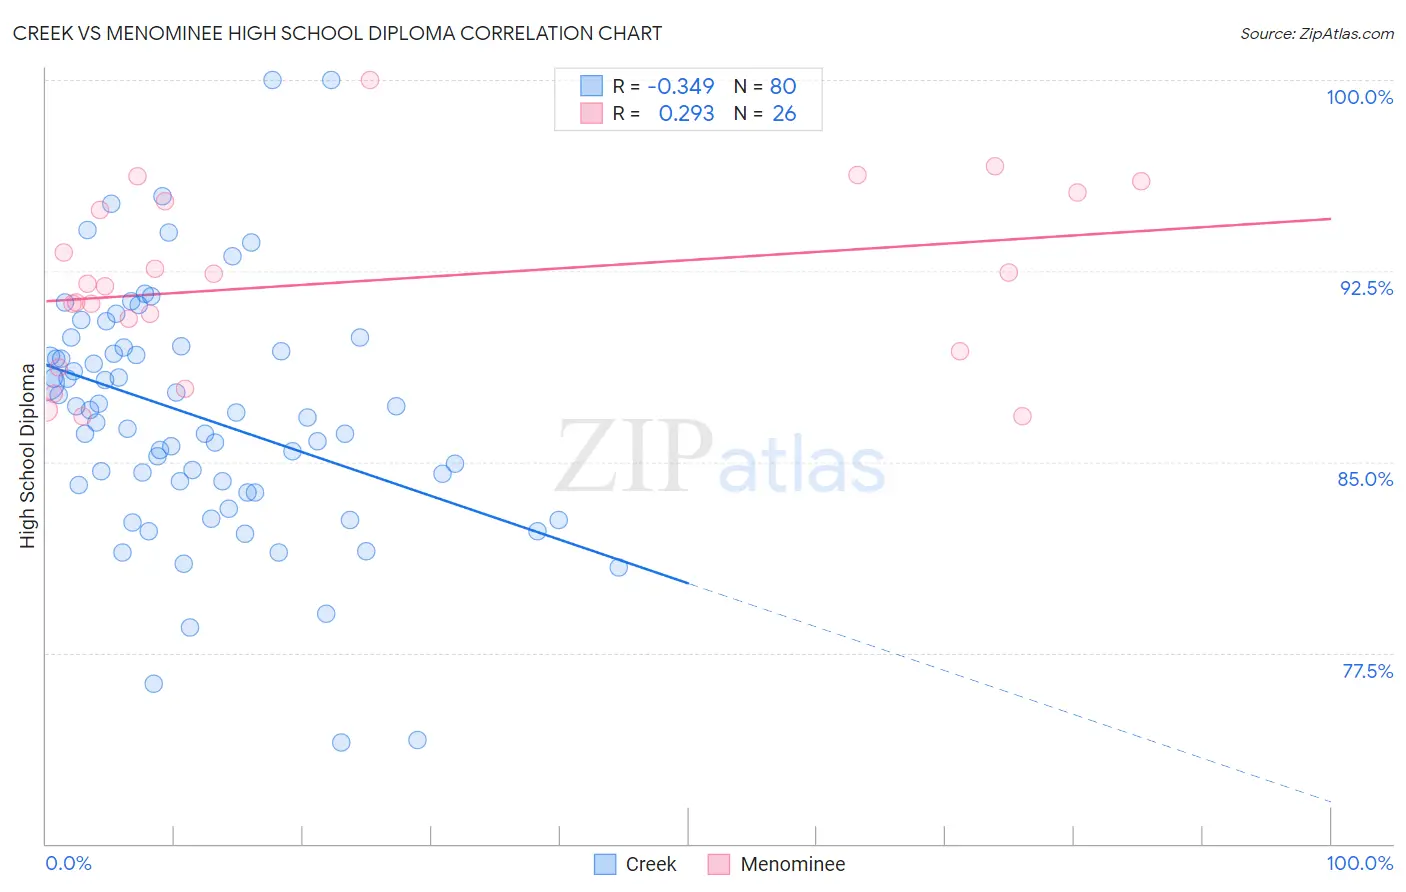
Creek vs Menominee High School Diploma Correlation Chart
The statistical analysis conducted on geographies consisting of 178,480,629 people shows a mild negative correlation between the proportion of Creek and percentage of population with at least high school diploma education in the United States with a correlation coefficient (R) of -0.349 and weighted average of 88.3%. Similarly, the statistical analysis conducted on geographies consisting of 45,778,979 people shows a weak positive correlation between the proportion of Menominee and percentage of population with at least high school diploma education in the United States with a correlation coefficient (R) of 0.293 and weighted average of 90.3%, a difference of 2.3%.
High School Diploma Correlation Summary
| Measurement | Creek | Menominee |
| Minimum | 74.0% | 86.8% |
| Maximum | 100.0% | 100.0% |
| Range | 26.0% | 13.2% |
| Mean | 86.8% | 92.1% |
| Median | 86.8% | 91.9% |
| Interquartile 25% (IQ1) | 83.9% | 89.3% |
| Interquartile 75% (IQ3) | 89.4% | 95.2% |
| Interquartile Range (IQR) | 5.5% | 5.9% |
| Standard Deviation (Sample) | 4.8% | 3.5% |
| Standard Deviation (Population) | 4.8% | 3.4% |
Similar Demographics by High School Diploma
Demographics Similar to Creek by High School Diploma
In terms of high school diploma, the demographic groups most similar to Creek are Shoshone (88.3%, a difference of 0.010%), Immigrants from Zaire (88.3%, a difference of 0.040%), Colville (88.3%, a difference of 0.050%), Uruguayan (88.2%, a difference of 0.080%), and Immigrants from Afghanistan (88.3%, a difference of 0.090%).
| Demographics | Rating | Rank | High School Diploma |
| Immigrants | Bolivia | 10.3 /100 | #218 | Poor 88.4% |
| Costa Ricans | 9.6 /100 | #219 | Tragic 88.4% |
| Tongans | 9.5 /100 | #220 | Tragic 88.4% |
| Immigrants | Afghanistan | 8.6 /100 | #221 | Tragic 88.3% |
| Colville | 7.8 /100 | #222 | Tragic 88.3% |
| Immigrants | Zaire | 7.6 /100 | #223 | Tragic 88.3% |
| Shoshone | 7.0 /100 | #224 | Tragic 88.3% |
| Creek | 6.9 /100 | #225 | Tragic 88.3% |
| Uruguayans | 5.6 /100 | #226 | Tragic 88.2% |
| Immigrants | Liberia | 5.5 /100 | #227 | Tragic 88.2% |
| Kiowa | 5.3 /100 | #228 | Tragic 88.2% |
| Nigerians | 5.2 /100 | #229 | Tragic 88.2% |
| Blackfeet | 4.2 /100 | #230 | Tragic 88.1% |
| Colombians | 3.8 /100 | #231 | Tragic 88.1% |
| Immigrants | Middle Africa | 3.4 /100 | #232 | Tragic 88.0% |
Demographics Similar to Menominee by High School Diploma
In terms of high school diploma, the demographic groups most similar to Menominee are Immigrants from Greece (90.3%, a difference of 0.0%), Palestinian (90.3%, a difference of 0.010%), Immigrants from Zimbabwe (90.3%, a difference of 0.010%), Immigrants from Russia (90.3%, a difference of 0.030%), and Immigrants from Belarus (90.2%, a difference of 0.030%).
| Demographics | Rating | Rank | High School Diploma |
| Immigrants | Croatia | 97.8 /100 | #104 | Exceptional 90.4% |
| Lebanese | 97.4 /100 | #105 | Exceptional 90.4% |
| Syrians | 97.0 /100 | #106 | Exceptional 90.3% |
| Immigrants | Russia | 96.9 /100 | #107 | Exceptional 90.3% |
| Palestinians | 96.7 /100 | #108 | Exceptional 90.3% |
| Immigrants | Zimbabwe | 96.7 /100 | #109 | Exceptional 90.3% |
| Immigrants | Greece | 96.6 /100 | #110 | Exceptional 90.3% |
| Menominee | 96.6 /100 | #111 | Exceptional 90.3% |
| Immigrants | Belarus | 96.4 /100 | #112 | Exceptional 90.2% |
| Immigrants | Sri Lanka | 96.3 /100 | #113 | Exceptional 90.2% |
| Yugoslavians | 96.2 /100 | #114 | Exceptional 90.2% |
| Immigrants | Hungary | 95.8 /100 | #115 | Exceptional 90.2% |
| Immigrants | Germany | 95.7 /100 | #116 | Exceptional 90.2% |
| Jordanians | 95.4 /100 | #117 | Exceptional 90.2% |
| Israelis | 95.1 /100 | #118 | Exceptional 90.1% |