Creek vs Chinese High School Diploma
COMPARE
Creek
Chinese
High School Diploma
High School Diploma Comparison
Creek
Chinese
88.3%
HIGH SCHOOL DIPLOMA
6.9/ 100
METRIC RATING
225th/ 347
METRIC RANK
92.0%
HIGH SCHOOL DIPLOMA
100.0/ 100
METRIC RATING
8th/ 347
METRIC RANK
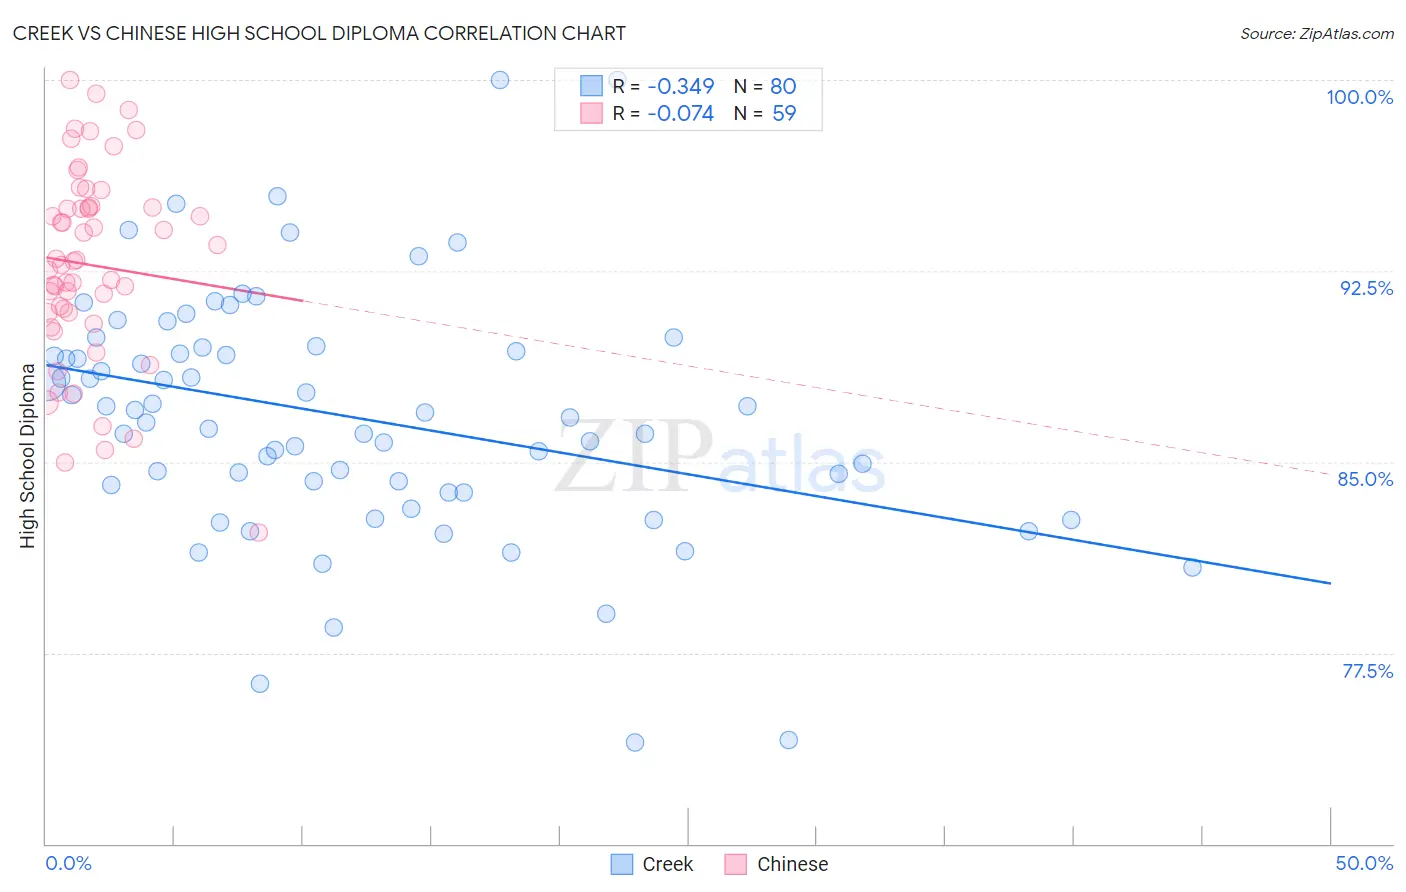
Creek vs Chinese High School Diploma Correlation Chart
The statistical analysis conducted on geographies consisting of 178,480,629 people shows a mild negative correlation between the proportion of Creek and percentage of population with at least high school diploma education in the United States with a correlation coefficient (R) of -0.349 and weighted average of 88.3%. Similarly, the statistical analysis conducted on geographies consisting of 64,809,883 people shows a slight negative correlation between the proportion of Chinese and percentage of population with at least high school diploma education in the United States with a correlation coefficient (R) of -0.074 and weighted average of 92.0%, a difference of 4.2%.
High School Diploma Correlation Summary
| Measurement | Creek | Chinese |
| Minimum | 74.0% | 82.2% |
| Maximum | 100.0% | 100.0% |
| Range | 26.0% | 17.8% |
| Mean | 86.8% | 92.7% |
| Median | 86.8% | 92.9% |
| Interquartile 25% (IQ1) | 83.9% | 90.8% |
| Interquartile 75% (IQ3) | 89.4% | 95.0% |
| Interquartile Range (IQR) | 5.5% | 4.1% |
| Standard Deviation (Sample) | 4.8% | 3.8% |
| Standard Deviation (Population) | 4.8% | 3.8% |
Similar Demographics by High School Diploma
Demographics Similar to Creek by High School Diploma
In terms of high school diploma, the demographic groups most similar to Creek are Shoshone (88.3%, a difference of 0.010%), Immigrants from Zaire (88.3%, a difference of 0.040%), Colville (88.3%, a difference of 0.050%), Uruguayan (88.2%, a difference of 0.080%), and Immigrants from Afghanistan (88.3%, a difference of 0.090%).
| Demographics | Rating | Rank | High School Diploma |
| Immigrants | Bolivia | 10.3 /100 | #218 | Poor 88.4% |
| Costa Ricans | 9.6 /100 | #219 | Tragic 88.4% |
| Tongans | 9.5 /100 | #220 | Tragic 88.4% |
| Immigrants | Afghanistan | 8.6 /100 | #221 | Tragic 88.3% |
| Colville | 7.8 /100 | #222 | Tragic 88.3% |
| Immigrants | Zaire | 7.6 /100 | #223 | Tragic 88.3% |
| Shoshone | 7.0 /100 | #224 | Tragic 88.3% |
| Creek | 6.9 /100 | #225 | Tragic 88.3% |
| Uruguayans | 5.6 /100 | #226 | Tragic 88.2% |
| Immigrants | Liberia | 5.5 /100 | #227 | Tragic 88.2% |
| Kiowa | 5.3 /100 | #228 | Tragic 88.2% |
| Nigerians | 5.2 /100 | #229 | Tragic 88.2% |
| Blackfeet | 4.2 /100 | #230 | Tragic 88.1% |
| Colombians | 3.8 /100 | #231 | Tragic 88.1% |
| Immigrants | Middle Africa | 3.4 /100 | #232 | Tragic 88.0% |
Demographics Similar to Chinese by High School Diploma
In terms of high school diploma, the demographic groups most similar to Chinese are Immigrants from India (92.0%, a difference of 0.010%), Latvian (92.0%, a difference of 0.010%), Slovak (92.0%, a difference of 0.020%), Lithuanian (92.0%, a difference of 0.040%), and Slovene (92.0%, a difference of 0.040%).
| Demographics | Rating | Rank | High School Diploma |
| Norwegians | 100.0 /100 | #1 | Exceptional 92.5% |
| Swedes | 100.0 /100 | #2 | Exceptional 92.2% |
| Carpatho Rusyns | 100.0 /100 | #3 | Exceptional 92.1% |
| Lithuanians | 100.0 /100 | #4 | Exceptional 92.0% |
| Slovenes | 100.0 /100 | #5 | Exceptional 92.0% |
| Slovaks | 100.0 /100 | #6 | Exceptional 92.0% |
| Immigrants | India | 100.0 /100 | #7 | Exceptional 92.0% |
| Chinese | 100.0 /100 | #8 | Exceptional 92.0% |
| Latvians | 100.0 /100 | #9 | Exceptional 92.0% |
| Croatians | 100.0 /100 | #10 | Exceptional 92.0% |
| Eastern Europeans | 100.0 /100 | #11 | Exceptional 91.9% |
| Poles | 100.0 /100 | #12 | Exceptional 91.9% |
| Danes | 100.0 /100 | #13 | Exceptional 91.8% |
| Bulgarians | 100.0 /100 | #14 | Exceptional 91.8% |
| Luxembourgers | 100.0 /100 | #15 | Exceptional 91.7% |