Creek vs Laotian Professional Degree
COMPARE
Creek
Laotian
Professional Degree
Professional Degree Comparison
Creek
Laotians
3.1%
PROFESSIONAL DEGREE
0.0/ 100
METRIC RATING
328th/ 347
METRIC RANK
5.2%
PROFESSIONAL DEGREE
99.5/ 100
METRIC RATING
91st/ 347
METRIC RANK
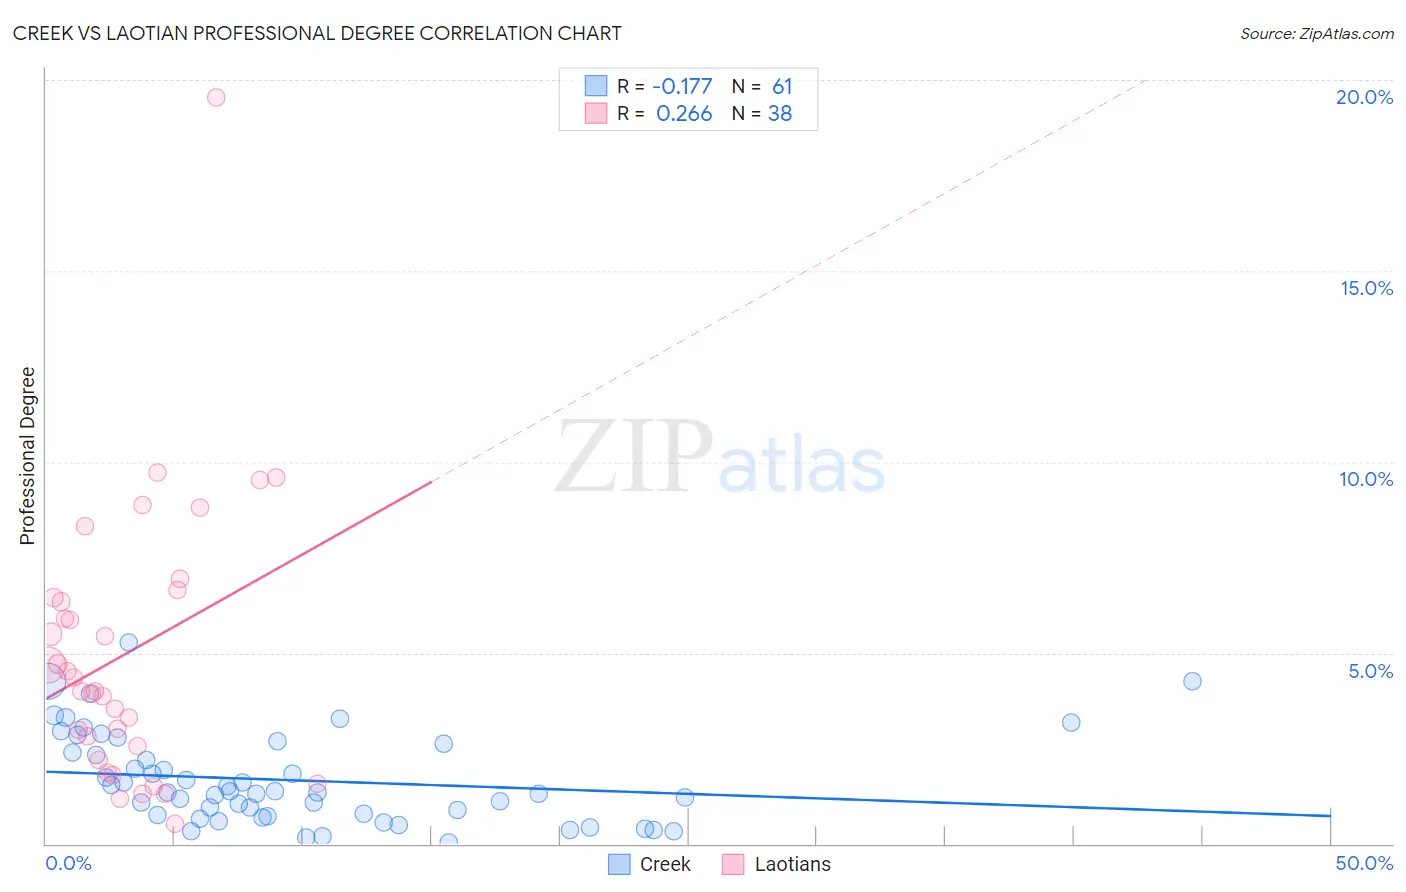
Creek vs Laotian Professional Degree Correlation Chart
The statistical analysis conducted on geographies consisting of 177,945,536 people shows a poor negative correlation between the proportion of Creek and percentage of population with at least professional degree education in the United States with a correlation coefficient (R) of -0.177 and weighted average of 3.1%. Similarly, the statistical analysis conducted on geographies consisting of 224,668,924 people shows a weak positive correlation between the proportion of Laotians and percentage of population with at least professional degree education in the United States with a correlation coefficient (R) of 0.266 and weighted average of 5.2%, a difference of 69.4%.
Professional Degree Correlation Summary
| Measurement | Creek | Laotian |
| Minimum | 0.045% | 0.53% |
| Maximum | 5.3% | 19.5% |
| Range | 5.2% | 19.0% |
| Mean | 1.7% | 5.0% |
| Median | 1.4% | 4.2% |
| Interquartile 25% (IQ1) | 0.73% | 2.6% |
| Interquartile 75% (IQ3) | 2.5% | 6.5% |
| Interquartile Range (IQR) | 1.8% | 3.9% |
| Standard Deviation (Sample) | 1.2% | 3.6% |
| Standard Deviation (Population) | 1.2% | 3.5% |
Similar Demographics by Professional Degree
Demographics Similar to Creek by Professional Degree
In terms of professional degree, the demographic groups most similar to Creek are Dutch West Indian (3.1%, a difference of 0.060%), Menominee (3.1%, a difference of 0.16%), Bangladeshi (3.1%, a difference of 0.21%), Immigrants from Cabo Verde (3.1%, a difference of 0.29%), and Kiowa (3.1%, a difference of 0.41%).
| Demographics | Rating | Rank | Professional Degree |
| Tsimshian | 0.0 /100 | #321 | Tragic 3.2% |
| Hispanics or Latinos | 0.0 /100 | #322 | Tragic 3.2% |
| Inupiat | 0.0 /100 | #323 | Tragic 3.2% |
| Crow | 0.0 /100 | #324 | Tragic 3.2% |
| Yaqui | 0.0 /100 | #325 | Tragic 3.2% |
| Menominee | 0.0 /100 | #326 | Tragic 3.1% |
| Dutch West Indians | 0.0 /100 | #327 | Tragic 3.1% |
| Creek | 0.0 /100 | #328 | Tragic 3.1% |
| Bangladeshis | 0.0 /100 | #329 | Tragic 3.1% |
| Immigrants | Cabo Verde | 0.0 /100 | #330 | Tragic 3.1% |
| Kiowa | 0.0 /100 | #331 | Tragic 3.1% |
| Yakama | 0.0 /100 | #332 | Tragic 3.1% |
| Puget Sound Salish | 0.0 /100 | #333 | Tragic 3.1% |
| Pennsylvania Germans | 0.0 /100 | #334 | Tragic 3.0% |
| Natives/Alaskans | 0.0 /100 | #335 | Tragic 3.0% |
Demographics Similar to Laotians by Professional Degree
In terms of professional degree, the demographic groups most similar to Laotians are Immigrants from Eastern Europe (5.2%, a difference of 0.040%), Immigrants from Scotland (5.3%, a difference of 0.16%), Chilean (5.3%, a difference of 0.26%), Egyptian (5.3%, a difference of 0.27%), and Immigrants from Chile (5.3%, a difference of 0.41%).
| Demographics | Rating | Rank | Professional Degree |
| Immigrants | Croatia | 99.6 /100 | #84 | Exceptional 5.3% |
| Immigrants | Zimbabwe | 99.6 /100 | #85 | Exceptional 5.3% |
| Greeks | 99.6 /100 | #86 | Exceptional 5.3% |
| Immigrants | Chile | 99.5 /100 | #87 | Exceptional 5.3% |
| Egyptians | 99.5 /100 | #88 | Exceptional 5.3% |
| Chileans | 99.5 /100 | #89 | Exceptional 5.3% |
| Immigrants | Scotland | 99.5 /100 | #90 | Exceptional 5.3% |
| Laotians | 99.5 /100 | #91 | Exceptional 5.2% |
| Immigrants | Eastern Europe | 99.5 /100 | #92 | Exceptional 5.2% |
| Northern Europeans | 99.3 /100 | #93 | Exceptional 5.2% |
| Alsatians | 99.3 /100 | #94 | Exceptional 5.2% |
| Zimbabweans | 99.3 /100 | #95 | Exceptional 5.2% |
| Immigrants | Uzbekistan | 99.2 /100 | #96 | Exceptional 5.2% |
| Syrians | 99.1 /100 | #97 | Exceptional 5.2% |
| Austrians | 99.1 /100 | #98 | Exceptional 5.2% |