Creek vs Immigrants from South Central Asia Professional Degree
COMPARE
Creek
Immigrants from South Central Asia
Professional Degree
Professional Degree Comparison
Creek
Immigrants from South Central Asia
3.1%
PROFESSIONAL DEGREE
0.0/ 100
METRIC RATING
328th/ 347
METRIC RANK
5.9%
PROFESSIONAL DEGREE
100.0/ 100
METRIC RATING
45th/ 347
METRIC RANK
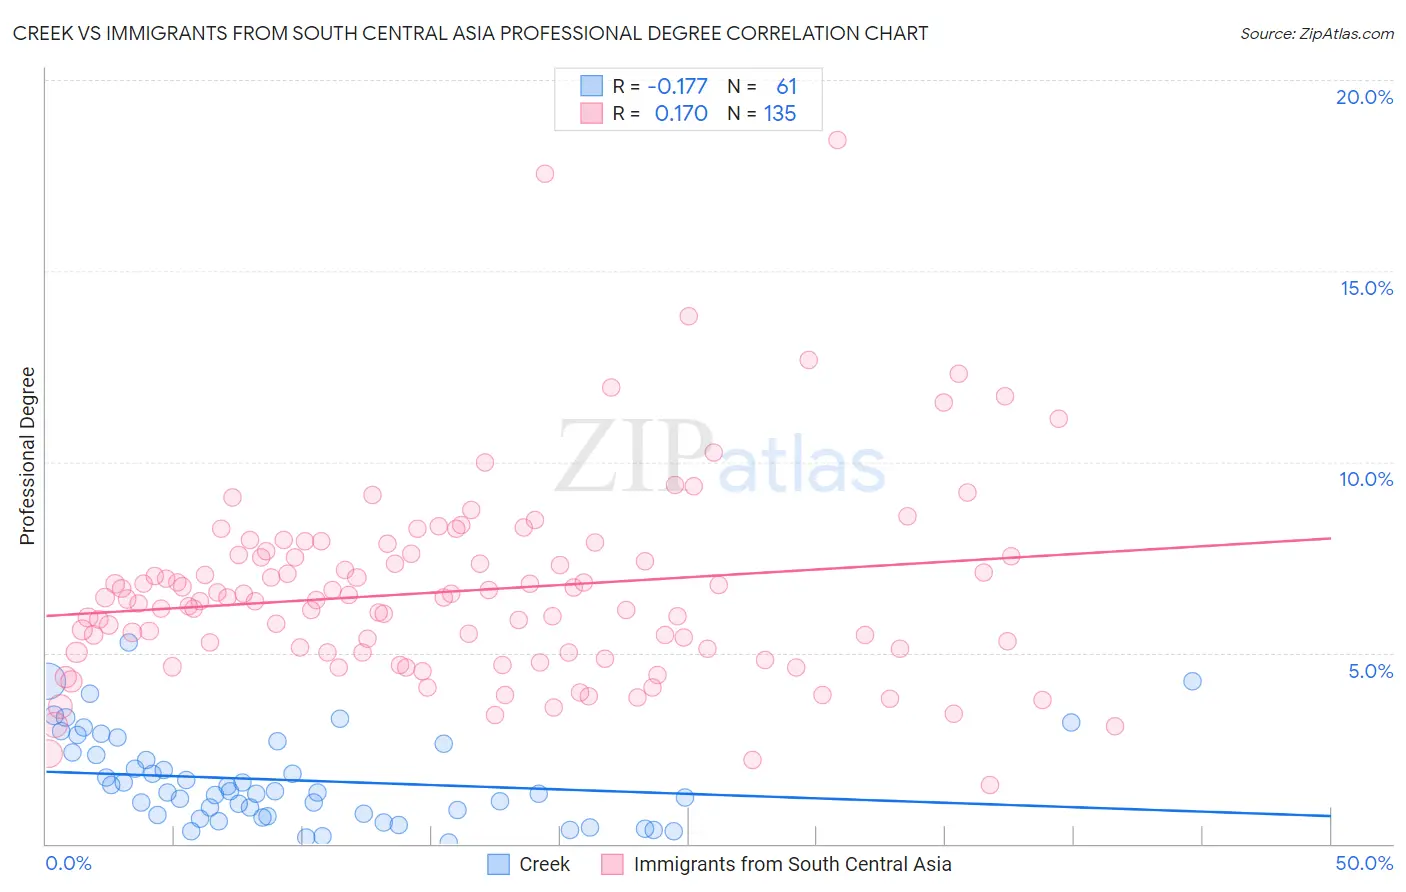
Creek vs Immigrants from South Central Asia Professional Degree Correlation Chart
The statistical analysis conducted on geographies consisting of 177,945,536 people shows a poor negative correlation between the proportion of Creek and percentage of population with at least professional degree education in the United States with a correlation coefficient (R) of -0.177 and weighted average of 3.1%. Similarly, the statistical analysis conducted on geographies consisting of 471,835,732 people shows a poor positive correlation between the proportion of Immigrants from South Central Asia and percentage of population with at least professional degree education in the United States with a correlation coefficient (R) of 0.170 and weighted average of 5.9%, a difference of 90.6%.
Professional Degree Correlation Summary
| Measurement | Creek | Immigrants from South Central Asia |
| Minimum | 0.045% | 1.5% |
| Maximum | 5.3% | 18.4% |
| Range | 5.2% | 16.9% |
| Mean | 1.7% | 6.6% |
| Median | 1.4% | 6.4% |
| Interquartile 25% (IQ1) | 0.73% | 5.0% |
| Interquartile 75% (IQ3) | 2.5% | 7.6% |
| Interquartile Range (IQR) | 1.8% | 2.5% |
| Standard Deviation (Sample) | 1.2% | 2.5% |
| Standard Deviation (Population) | 1.2% | 2.5% |
Similar Demographics by Professional Degree
Demographics Similar to Creek by Professional Degree
In terms of professional degree, the demographic groups most similar to Creek are Dutch West Indian (3.1%, a difference of 0.060%), Menominee (3.1%, a difference of 0.16%), Bangladeshi (3.1%, a difference of 0.21%), Immigrants from Cabo Verde (3.1%, a difference of 0.29%), and Kiowa (3.1%, a difference of 0.41%).
| Demographics | Rating | Rank | Professional Degree |
| Tsimshian | 0.0 /100 | #321 | Tragic 3.2% |
| Hispanics or Latinos | 0.0 /100 | #322 | Tragic 3.2% |
| Inupiat | 0.0 /100 | #323 | Tragic 3.2% |
| Crow | 0.0 /100 | #324 | Tragic 3.2% |
| Yaqui | 0.0 /100 | #325 | Tragic 3.2% |
| Menominee | 0.0 /100 | #326 | Tragic 3.1% |
| Dutch West Indians | 0.0 /100 | #327 | Tragic 3.1% |
| Creek | 0.0 /100 | #328 | Tragic 3.1% |
| Bangladeshis | 0.0 /100 | #329 | Tragic 3.1% |
| Immigrants | Cabo Verde | 0.0 /100 | #330 | Tragic 3.1% |
| Kiowa | 0.0 /100 | #331 | Tragic 3.1% |
| Yakama | 0.0 /100 | #332 | Tragic 3.1% |
| Puget Sound Salish | 0.0 /100 | #333 | Tragic 3.1% |
| Pennsylvania Germans | 0.0 /100 | #334 | Tragic 3.0% |
| Natives/Alaskans | 0.0 /100 | #335 | Tragic 3.0% |
Demographics Similar to Immigrants from South Central Asia by Professional Degree
In terms of professional degree, the demographic groups most similar to Immigrants from South Central Asia are Immigrants from Argentina (5.9%, a difference of 0.21%), Australian (5.9%, a difference of 0.22%), Argentinean (5.9%, a difference of 0.45%), Immigrants from Saudi Arabia (5.9%, a difference of 0.61%), and Paraguayan (5.9%, a difference of 0.63%).
| Demographics | Rating | Rank | Professional Degree |
| Immigrants | Norway | 100.0 /100 | #38 | Exceptional 6.0% |
| Immigrants | South Africa | 100.0 /100 | #39 | Exceptional 6.0% |
| Cambodians | 100.0 /100 | #40 | Exceptional 6.0% |
| New Zealanders | 100.0 /100 | #41 | Exceptional 6.0% |
| Estonians | 100.0 /100 | #42 | Exceptional 6.0% |
| Immigrants | Saudi Arabia | 100.0 /100 | #43 | Exceptional 5.9% |
| Argentineans | 100.0 /100 | #44 | Exceptional 5.9% |
| Immigrants | South Central Asia | 100.0 /100 | #45 | Exceptional 5.9% |
| Immigrants | Argentina | 100.0 /100 | #46 | Exceptional 5.9% |
| Australians | 100.0 /100 | #47 | Exceptional 5.9% |
| Paraguayans | 100.0 /100 | #48 | Exceptional 5.9% |
| Immigrants | Latvia | 100.0 /100 | #49 | Exceptional 5.8% |
| Immigrants | Czechoslovakia | 100.0 /100 | #50 | Exceptional 5.8% |
| Immigrants | Greece | 100.0 /100 | #51 | Exceptional 5.8% |
| Immigrants | Serbia | 100.0 /100 | #52 | Exceptional 5.8% |