Creek vs Pima Professional Degree
COMPARE
Creek
Pima
Professional Degree
Professional Degree Comparison
Creek
Pima
3.1%
PROFESSIONAL DEGREE
0.0/ 100
METRIC RATING
328th/ 347
METRIC RANK
3.3%
PROFESSIONAL DEGREE
0.1/ 100
METRIC RATING
309th/ 347
METRIC RANK
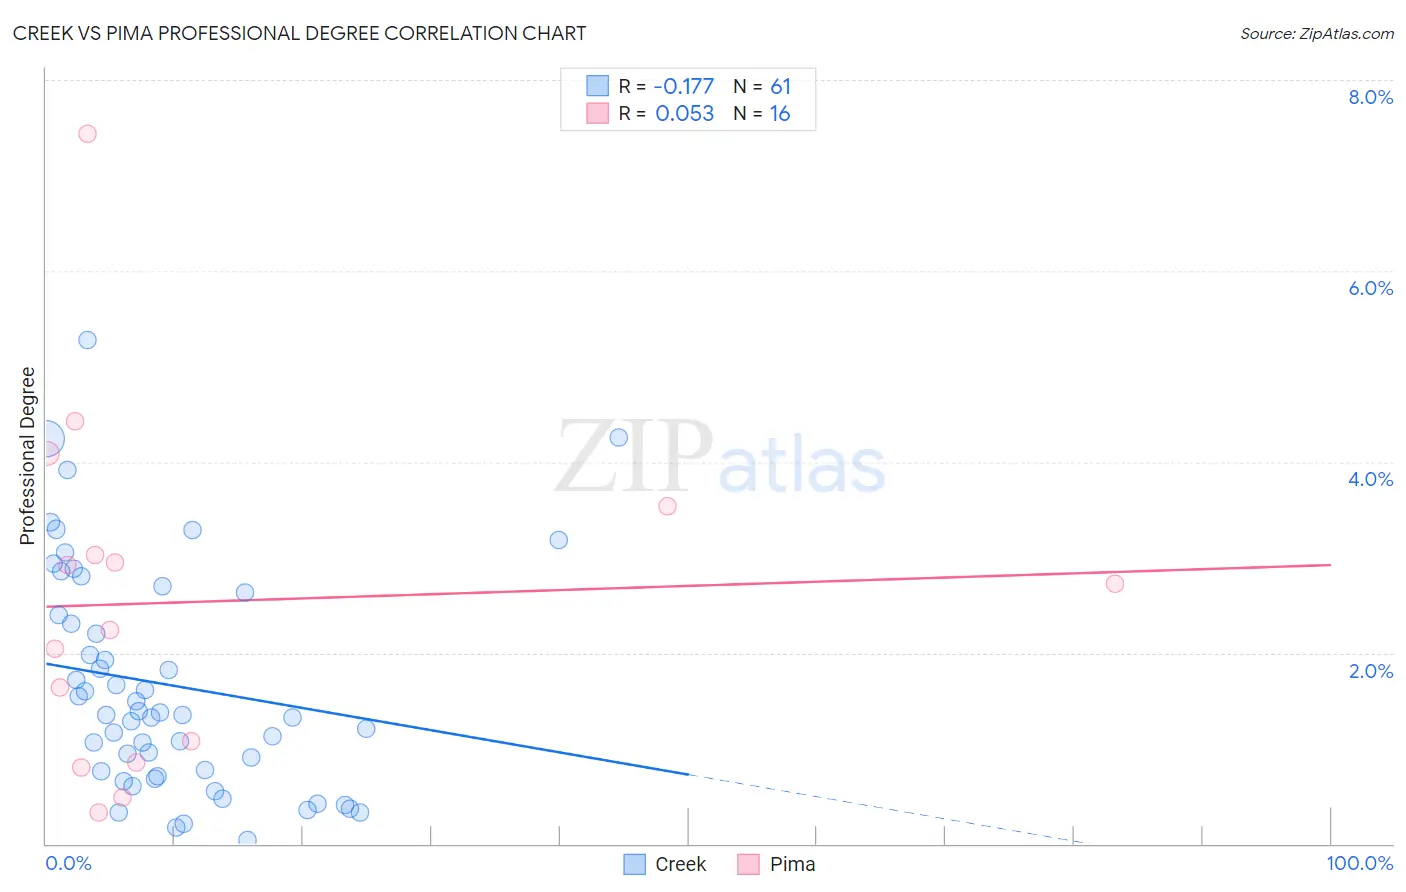
Creek vs Pima Professional Degree Correlation Chart
The statistical analysis conducted on geographies consisting of 177,945,536 people shows a poor negative correlation between the proportion of Creek and percentage of population with at least professional degree education in the United States with a correlation coefficient (R) of -0.177 and weighted average of 3.1%. Similarly, the statistical analysis conducted on geographies consisting of 61,434,084 people shows a slight positive correlation between the proportion of Pima and percentage of population with at least professional degree education in the United States with a correlation coefficient (R) of 0.053 and weighted average of 3.3%, a difference of 6.9%.
Professional Degree Correlation Summary
| Measurement | Creek | Pima |
| Minimum | 0.045% | 0.33% |
| Maximum | 5.3% | 7.4% |
| Range | 5.2% | 7.1% |
| Mean | 1.7% | 2.5% |
| Median | 1.4% | 2.5% |
| Interquartile 25% (IQ1) | 0.73% | 0.96% |
| Interquartile 75% (IQ3) | 2.5% | 3.3% |
| Interquartile Range (IQR) | 1.8% | 2.3% |
| Standard Deviation (Sample) | 1.2% | 1.8% |
| Standard Deviation (Population) | 1.2% | 1.8% |
Demographics Similar to Creek and Pima by Professional Degree
In terms of professional degree, the demographic groups most similar to Creek are Dutch West Indian (3.1%, a difference of 0.060%), Menominee (3.1%, a difference of 0.16%), Yaqui (3.2%, a difference of 1.9%), Crow (3.2%, a difference of 2.0%), and Inupiat (3.2%, a difference of 2.3%). Similarly, the demographic groups most similar to Pima are Shoshone (3.3%, a difference of 0.010%), Immigrants from Latin America (3.3%, a difference of 0.32%), Cherokee (3.3%, a difference of 0.47%), Sioux (3.3%, a difference of 1.1%), and Yuman (3.3%, a difference of 1.1%).
| Demographics | Rating | Rank | Professional Degree |
| Shoshone | 0.1 /100 | #308 | Tragic 3.3% |
| Pima | 0.1 /100 | #309 | Tragic 3.3% |
| Immigrants | Latin America | 0.1 /100 | #310 | Tragic 3.3% |
| Cherokee | 0.1 /100 | #311 | Tragic 3.3% |
| Sioux | 0.1 /100 | #312 | Tragic 3.3% |
| Yuman | 0.1 /100 | #313 | Tragic 3.3% |
| Mexican American Indians | 0.1 /100 | #314 | Tragic 3.3% |
| Immigrants | Laos | 0.1 /100 | #315 | Tragic 3.2% |
| Puerto Ricans | 0.1 /100 | #316 | Tragic 3.2% |
| Nepalese | 0.1 /100 | #317 | Tragic 3.2% |
| Immigrants | Micronesia | 0.1 /100 | #318 | Tragic 3.2% |
| Choctaw | 0.1 /100 | #319 | Tragic 3.2% |
| Seminole | 0.1 /100 | #320 | Tragic 3.2% |
| Tsimshian | 0.0 /100 | #321 | Tragic 3.2% |
| Hispanics or Latinos | 0.0 /100 | #322 | Tragic 3.2% |
| Inupiat | 0.0 /100 | #323 | Tragic 3.2% |
| Crow | 0.0 /100 | #324 | Tragic 3.2% |
| Yaqui | 0.0 /100 | #325 | Tragic 3.2% |
| Menominee | 0.0 /100 | #326 | Tragic 3.1% |
| Dutch West Indians | 0.0 /100 | #327 | Tragic 3.1% |
| Creek | 0.0 /100 | #328 | Tragic 3.1% |