Dominican vs Laotian Professional Degree
COMPARE
Dominican
Laotian
Professional Degree
Professional Degree Comparison
Dominicans
Laotians
3.5%
PROFESSIONAL DEGREE
0.5/ 100
METRIC RATING
280th/ 347
METRIC RANK
5.2%
PROFESSIONAL DEGREE
99.5/ 100
METRIC RATING
91st/ 347
METRIC RANK
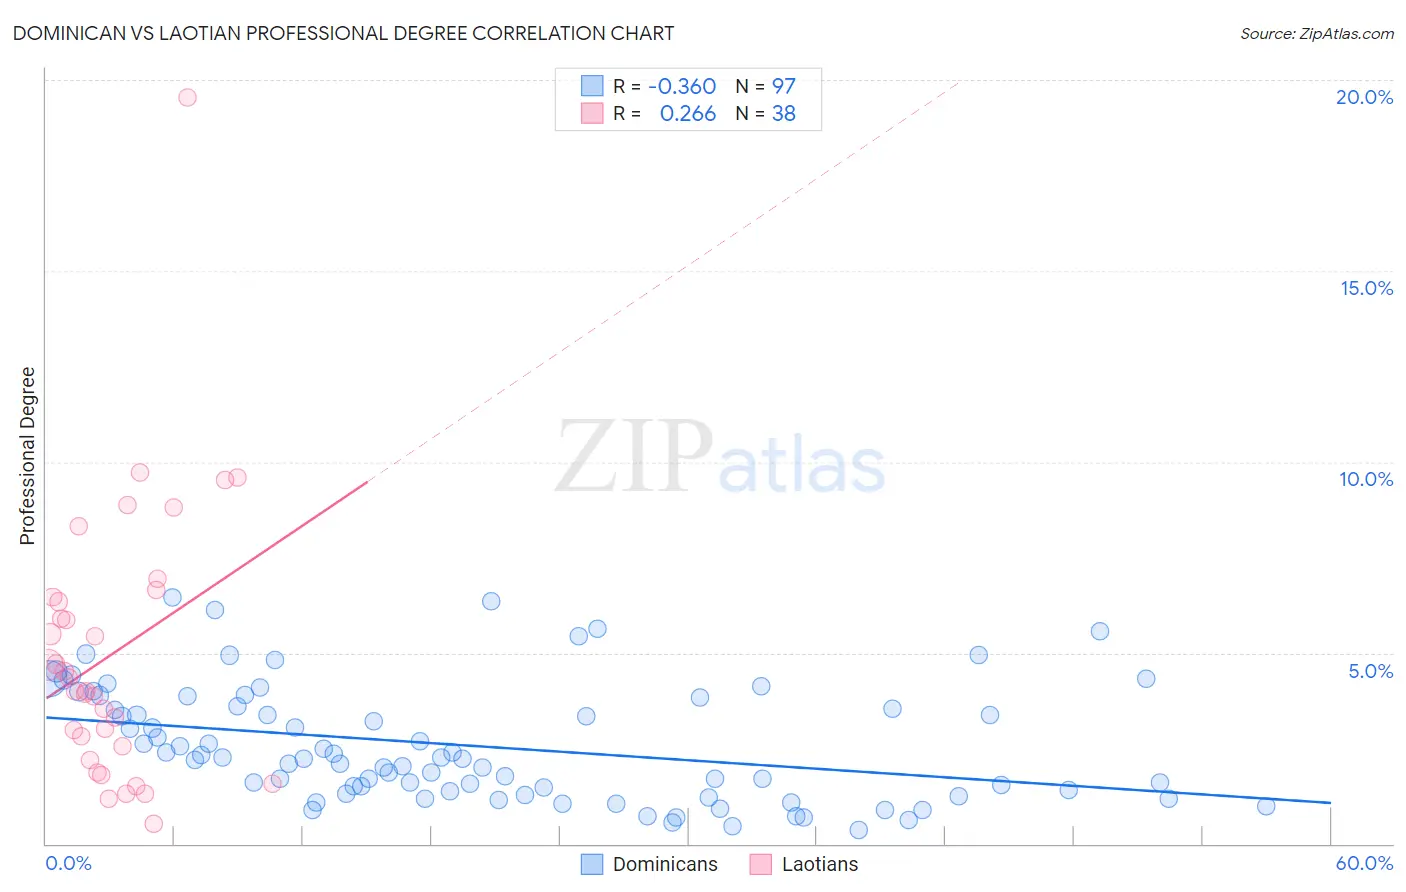
Dominican vs Laotian Professional Degree Correlation Chart
The statistical analysis conducted on geographies consisting of 354,076,987 people shows a mild negative correlation between the proportion of Dominicans and percentage of population with at least professional degree education in the United States with a correlation coefficient (R) of -0.360 and weighted average of 3.5%. Similarly, the statistical analysis conducted on geographies consisting of 224,668,924 people shows a weak positive correlation between the proportion of Laotians and percentage of population with at least professional degree education in the United States with a correlation coefficient (R) of 0.266 and weighted average of 5.2%, a difference of 47.9%.
Professional Degree Correlation Summary
| Measurement | Dominican | Laotian |
| Minimum | 0.36% | 0.53% |
| Maximum | 6.5% | 19.5% |
| Range | 6.1% | 19.0% |
| Mean | 2.6% | 5.0% |
| Median | 2.2% | 4.2% |
| Interquartile 25% (IQ1) | 1.3% | 2.6% |
| Interquartile 75% (IQ3) | 3.7% | 6.5% |
| Interquartile Range (IQR) | 2.4% | 3.9% |
| Standard Deviation (Sample) | 1.5% | 3.6% |
| Standard Deviation (Population) | 1.5% | 3.5% |
Similar Demographics by Professional Degree
Demographics Similar to Dominicans by Professional Degree
In terms of professional degree, the demographic groups most similar to Dominicans are Apache (3.5%, a difference of 0.030%), Immigrants from Portugal (3.5%, a difference of 0.040%), Immigrants from Caribbean (3.5%, a difference of 0.050%), Japanese (3.5%, a difference of 0.080%), and Cheyenne (3.6%, a difference of 0.13%).
| Demographics | Rating | Rank | Professional Degree |
| Americans | 0.5 /100 | #273 | Tragic 3.6% |
| Potawatomi | 0.5 /100 | #274 | Tragic 3.6% |
| Immigrants | Dominica | 0.5 /100 | #275 | Tragic 3.6% |
| Liberians | 0.5 /100 | #276 | Tragic 3.6% |
| Cheyenne | 0.5 /100 | #277 | Tragic 3.6% |
| Japanese | 0.5 /100 | #278 | Tragic 3.5% |
| Immigrants | Portugal | 0.5 /100 | #279 | Tragic 3.5% |
| Dominicans | 0.5 /100 | #280 | Tragic 3.5% |
| Apache | 0.5 /100 | #281 | Tragic 3.5% |
| Immigrants | Caribbean | 0.5 /100 | #282 | Tragic 3.5% |
| Comanche | 0.4 /100 | #283 | Tragic 3.5% |
| Salvadorans | 0.4 /100 | #284 | Tragic 3.5% |
| Hondurans | 0.3 /100 | #285 | Tragic 3.5% |
| Haitians | 0.3 /100 | #286 | Tragic 3.5% |
| Immigrants | El Salvador | 0.3 /100 | #287 | Tragic 3.5% |
Demographics Similar to Laotians by Professional Degree
In terms of professional degree, the demographic groups most similar to Laotians are Immigrants from Eastern Europe (5.2%, a difference of 0.040%), Immigrants from Scotland (5.3%, a difference of 0.16%), Chilean (5.3%, a difference of 0.26%), Egyptian (5.3%, a difference of 0.27%), and Immigrants from Chile (5.3%, a difference of 0.41%).
| Demographics | Rating | Rank | Professional Degree |
| Immigrants | Croatia | 99.6 /100 | #84 | Exceptional 5.3% |
| Immigrants | Zimbabwe | 99.6 /100 | #85 | Exceptional 5.3% |
| Greeks | 99.6 /100 | #86 | Exceptional 5.3% |
| Immigrants | Chile | 99.5 /100 | #87 | Exceptional 5.3% |
| Egyptians | 99.5 /100 | #88 | Exceptional 5.3% |
| Chileans | 99.5 /100 | #89 | Exceptional 5.3% |
| Immigrants | Scotland | 99.5 /100 | #90 | Exceptional 5.3% |
| Laotians | 99.5 /100 | #91 | Exceptional 5.2% |
| Immigrants | Eastern Europe | 99.5 /100 | #92 | Exceptional 5.2% |
| Northern Europeans | 99.3 /100 | #93 | Exceptional 5.2% |
| Alsatians | 99.3 /100 | #94 | Exceptional 5.2% |
| Zimbabweans | 99.3 /100 | #95 | Exceptional 5.2% |
| Immigrants | Uzbekistan | 99.2 /100 | #96 | Exceptional 5.2% |
| Syrians | 99.1 /100 | #97 | Exceptional 5.2% |
| Austrians | 99.1 /100 | #98 | Exceptional 5.2% |