Creek vs Palestinian Professional Degree
COMPARE
Creek
Palestinian
Professional Degree
Professional Degree Comparison
Creek
Palestinians
3.1%
PROFESSIONAL DEGREE
0.0/ 100
METRIC RATING
328th/ 347
METRIC RANK
4.8%
PROFESSIONAL DEGREE
91.5/ 100
METRIC RATING
129th/ 347
METRIC RANK
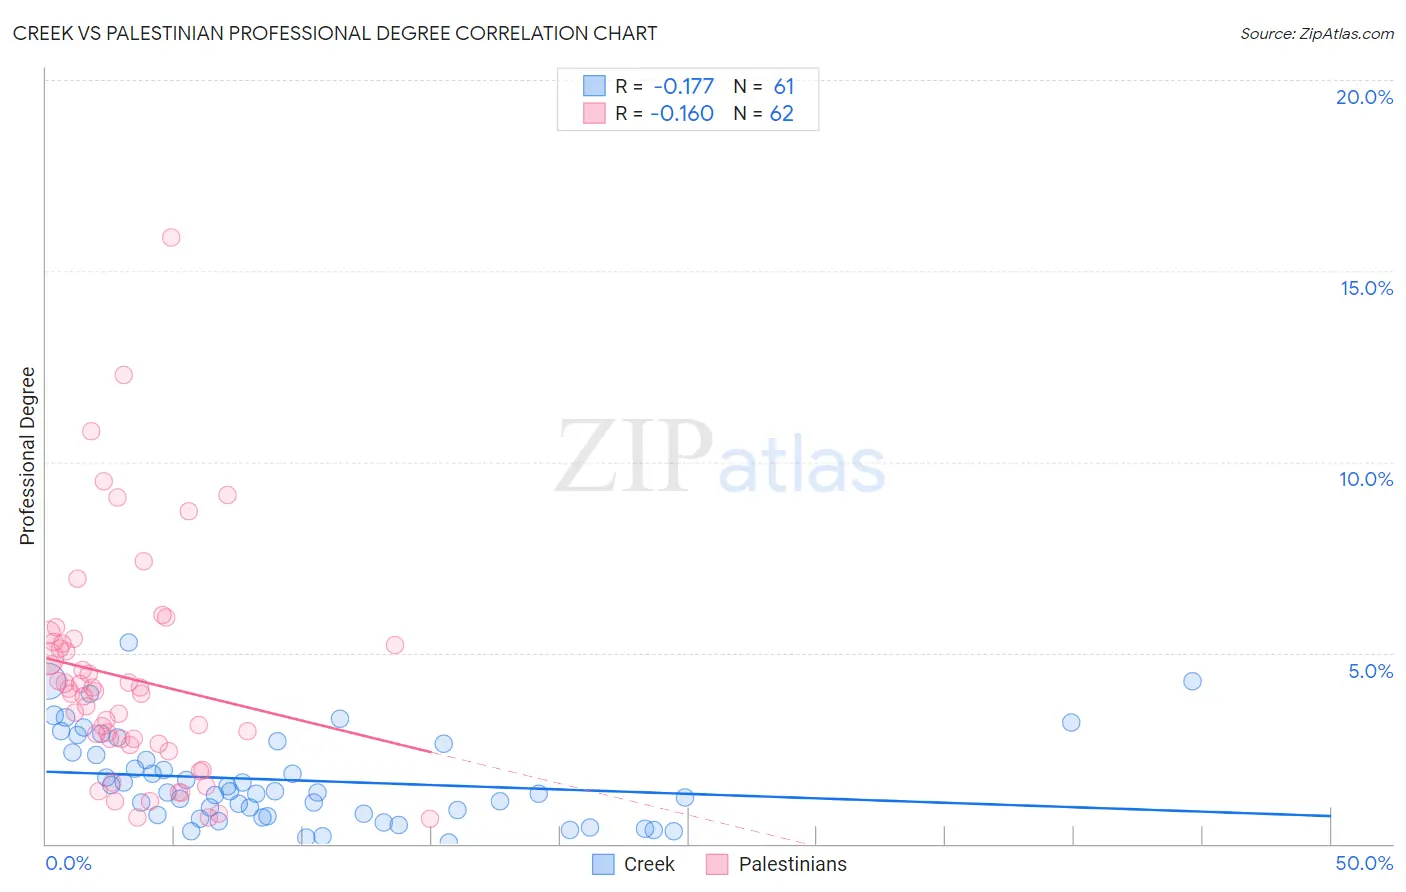
Creek vs Palestinian Professional Degree Correlation Chart
The statistical analysis conducted on geographies consisting of 177,945,536 people shows a poor negative correlation between the proportion of Creek and percentage of population with at least professional degree education in the United States with a correlation coefficient (R) of -0.177 and weighted average of 3.1%. Similarly, the statistical analysis conducted on geographies consisting of 216,348,582 people shows a poor negative correlation between the proportion of Palestinians and percentage of population with at least professional degree education in the United States with a correlation coefficient (R) of -0.160 and weighted average of 4.8%, a difference of 54.6%.
Professional Degree Correlation Summary
| Measurement | Creek | Palestinian |
| Minimum | 0.045% | 0.66% |
| Maximum | 5.3% | 15.9% |
| Range | 5.2% | 15.2% |
| Mean | 1.7% | 4.3% |
| Median | 1.4% | 4.0% |
| Interquartile 25% (IQ1) | 0.73% | 2.6% |
| Interquartile 75% (IQ3) | 2.5% | 5.2% |
| Interquartile Range (IQR) | 1.8% | 2.6% |
| Standard Deviation (Sample) | 1.2% | 2.9% |
| Standard Deviation (Population) | 1.2% | 2.9% |
Similar Demographics by Professional Degree
Demographics Similar to Creek by Professional Degree
In terms of professional degree, the demographic groups most similar to Creek are Dutch West Indian (3.1%, a difference of 0.060%), Menominee (3.1%, a difference of 0.16%), Bangladeshi (3.1%, a difference of 0.21%), Immigrants from Cabo Verde (3.1%, a difference of 0.29%), and Kiowa (3.1%, a difference of 0.41%).
| Demographics | Rating | Rank | Professional Degree |
| Tsimshian | 0.0 /100 | #321 | Tragic 3.2% |
| Hispanics or Latinos | 0.0 /100 | #322 | Tragic 3.2% |
| Inupiat | 0.0 /100 | #323 | Tragic 3.2% |
| Crow | 0.0 /100 | #324 | Tragic 3.2% |
| Yaqui | 0.0 /100 | #325 | Tragic 3.2% |
| Menominee | 0.0 /100 | #326 | Tragic 3.1% |
| Dutch West Indians | 0.0 /100 | #327 | Tragic 3.1% |
| Creek | 0.0 /100 | #328 | Tragic 3.1% |
| Bangladeshis | 0.0 /100 | #329 | Tragic 3.1% |
| Immigrants | Cabo Verde | 0.0 /100 | #330 | Tragic 3.1% |
| Kiowa | 0.0 /100 | #331 | Tragic 3.1% |
| Yakama | 0.0 /100 | #332 | Tragic 3.1% |
| Puget Sound Salish | 0.0 /100 | #333 | Tragic 3.1% |
| Pennsylvania Germans | 0.0 /100 | #334 | Tragic 3.0% |
| Natives/Alaskans | 0.0 /100 | #335 | Tragic 3.0% |
Demographics Similar to Palestinians by Professional Degree
In terms of professional degree, the demographic groups most similar to Palestinians are Icelander (4.8%, a difference of 0.030%), Immigrants from Nepal (4.8%, a difference of 0.050%), Pakistani (4.8%, a difference of 0.27%), Immigrants from Eastern Africa (4.8%, a difference of 0.46%), and Serbian (4.8%, a difference of 0.48%).
| Demographics | Rating | Rank | Professional Degree |
| Immigrants | Germany | 94.1 /100 | #122 | Exceptional 4.9% |
| Immigrants | Venezuela | 93.8 /100 | #123 | Exceptional 4.8% |
| Immigrants | Eritrea | 93.5 /100 | #124 | Exceptional 4.8% |
| Immigrants | Albania | 93.3 /100 | #125 | Exceptional 4.8% |
| Europeans | 93.2 /100 | #126 | Exceptional 4.8% |
| Serbians | 92.6 /100 | #127 | Exceptional 4.8% |
| Immigrants | Eastern Africa | 92.5 /100 | #128 | Exceptional 4.8% |
| Palestinians | 91.5 /100 | #129 | Exceptional 4.8% |
| Icelanders | 91.5 /100 | #130 | Exceptional 4.8% |
| Immigrants | Nepal | 91.4 /100 | #131 | Exceptional 4.8% |
| Pakistanis | 90.9 /100 | #132 | Exceptional 4.8% |
| Italians | 90.2 /100 | #133 | Exceptional 4.8% |
| South American Indians | 89.9 /100 | #134 | Excellent 4.8% |
| Macedonians | 89.8 /100 | #135 | Excellent 4.8% |
| Immigrants | Jordan | 89.0 /100 | #136 | Excellent 4.7% |