Creek vs Laotian Single Mother Poverty
COMPARE
Creek
Laotian
Single Mother Poverty
Single Mother Poverty Comparison
Creek
Laotians
36.7%
SINGLE MOTHER POVERTY
0.0/ 100
METRIC RATING
331st/ 347
METRIC RANK
27.0%
SINGLE MOTHER POVERTY
99.8/ 100
METRIC RATING
50th/ 347
METRIC RANK
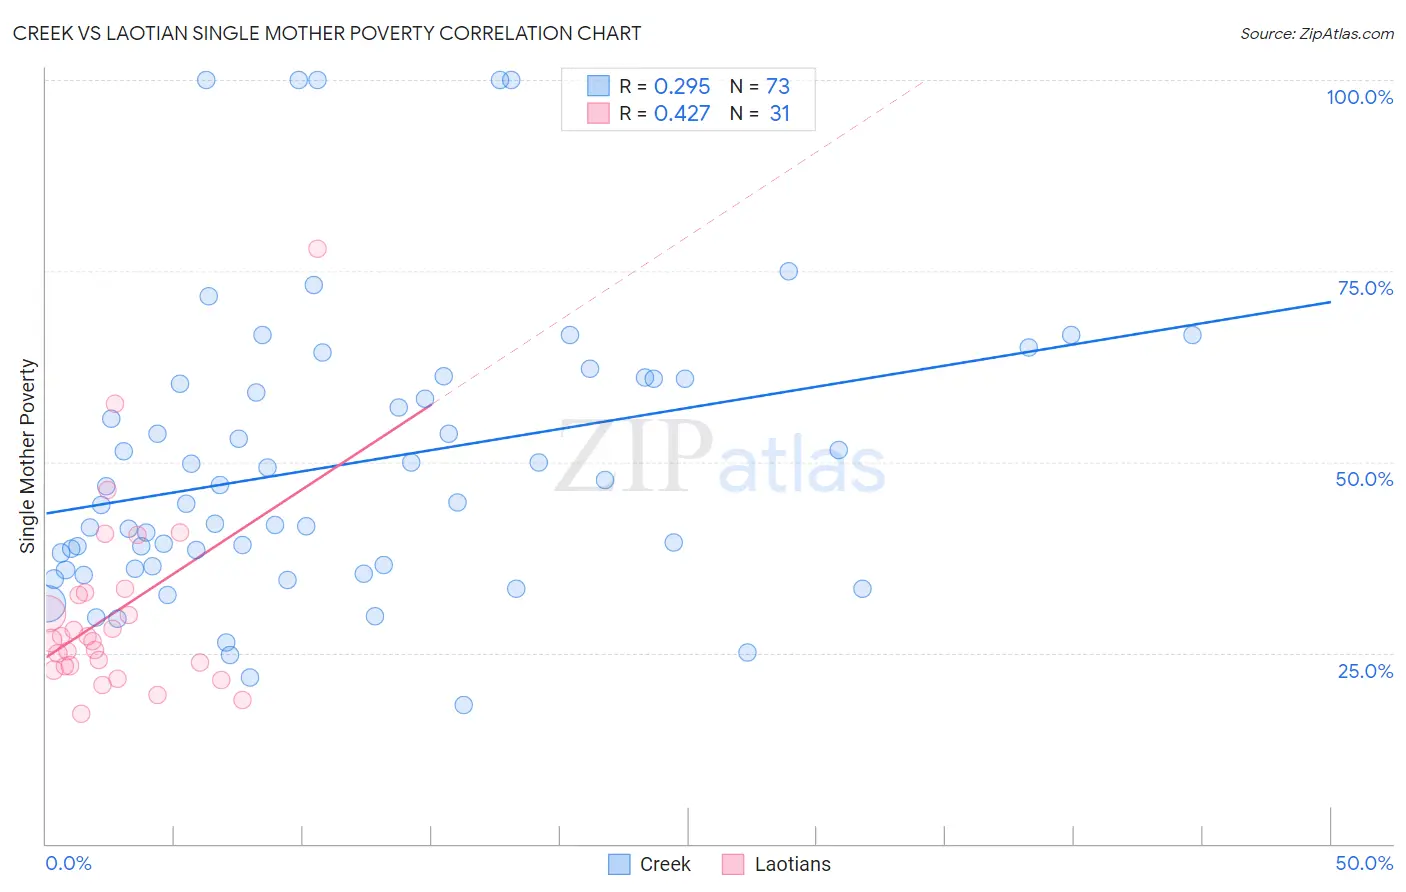
Creek vs Laotian Single Mother Poverty Correlation Chart
The statistical analysis conducted on geographies consisting of 177,086,597 people shows a weak positive correlation between the proportion of Creek and poverty level among single mothers in the United States with a correlation coefficient (R) of 0.295 and weighted average of 36.7%. Similarly, the statistical analysis conducted on geographies consisting of 221,717,898 people shows a moderate positive correlation between the proportion of Laotians and poverty level among single mothers in the United States with a correlation coefficient (R) of 0.427 and weighted average of 27.0%, a difference of 36.1%.
Single Mother Poverty Correlation Summary
| Measurement | Creek | Laotian |
| Minimum | 18.2% | 17.0% |
| Maximum | 100.0% | 78.0% |
| Range | 81.8% | 60.9% |
| Mean | 49.7% | 30.2% |
| Median | 44.7% | 26.6% |
| Interquartile 25% (IQ1) | 36.1% | 23.3% |
| Interquartile 75% (IQ3) | 60.9% | 32.8% |
| Interquartile Range (IQR) | 24.8% | 9.6% |
| Standard Deviation (Sample) | 19.0% | 12.5% |
| Standard Deviation (Population) | 18.9% | 12.3% |
Similar Demographics by Single Mother Poverty
Demographics Similar to Creek by Single Mother Poverty
In terms of single mother poverty, the demographic groups most similar to Creek are Native/Alaskan (36.6%, a difference of 0.16%), Dutch West Indian (36.8%, a difference of 0.24%), Apache (36.6%, a difference of 0.26%), Choctaw (36.4%, a difference of 0.74%), and Yakama (36.4%, a difference of 0.79%).
| Demographics | Rating | Rank | Single Mother Poverty |
| Ottawa | 0.0 /100 | #324 | Tragic 35.5% |
| Ute | 0.0 /100 | #325 | Tragic 35.7% |
| Seminole | 0.0 /100 | #326 | Tragic 35.8% |
| Yakama | 0.0 /100 | #327 | Tragic 36.4% |
| Choctaw | 0.0 /100 | #328 | Tragic 36.4% |
| Apache | 0.0 /100 | #329 | Tragic 36.6% |
| Natives/Alaskans | 0.0 /100 | #330 | Tragic 36.6% |
| Creek | 0.0 /100 | #331 | Tragic 36.7% |
| Dutch West Indians | 0.0 /100 | #332 | Tragic 36.8% |
| Menominee | 0.0 /100 | #333 | Tragic 37.1% |
| Pueblo | 0.0 /100 | #334 | Tragic 37.2% |
| Yuman | 0.0 /100 | #335 | Tragic 37.8% |
| Cheyenne | 0.0 /100 | #336 | Tragic 38.5% |
| Immigrants | Yemen | 0.0 /100 | #337 | Tragic 38.5% |
| Pima | 0.0 /100 | #338 | Tragic 38.6% |
Demographics Similar to Laotians by Single Mother Poverty
In terms of single mother poverty, the demographic groups most similar to Laotians are Cambodian (27.0%, a difference of 0.010%), Immigrants from Poland (26.9%, a difference of 0.090%), Egyptian (26.9%, a difference of 0.17%), Immigrants from Serbia (26.9%, a difference of 0.23%), and Latvian (26.9%, a difference of 0.27%).
| Demographics | Rating | Rank | Single Mother Poverty |
| Tsimshian | 99.9 /100 | #43 | Exceptional 26.8% |
| Immigrants | Sierra Leone | 99.9 /100 | #44 | Exceptional 26.9% |
| Latvians | 99.9 /100 | #45 | Exceptional 26.9% |
| Immigrants | Serbia | 99.9 /100 | #46 | Exceptional 26.9% |
| Egyptians | 99.8 /100 | #47 | Exceptional 26.9% |
| Immigrants | Poland | 99.8 /100 | #48 | Exceptional 26.9% |
| Cambodians | 99.8 /100 | #49 | Exceptional 27.0% |
| Laotians | 99.8 /100 | #50 | Exceptional 27.0% |
| Immigrants | Argentina | 99.7 /100 | #51 | Exceptional 27.1% |
| Immigrants | South Eastern Asia | 99.7 /100 | #52 | Exceptional 27.1% |
| Immigrants | Jordan | 99.7 /100 | #53 | Exceptional 27.1% |
| Immigrants | Bulgaria | 99.7 /100 | #54 | Exceptional 27.1% |
| Immigrants | Egypt | 99.7 /100 | #55 | Exceptional 27.1% |
| Immigrants | Romania | 99.7 /100 | #56 | Exceptional 27.2% |
| Palestinians | 99.7 /100 | #57 | Exceptional 27.2% |