Creek vs Indonesian Professional Degree
COMPARE
Creek
Indonesian
Professional Degree
Professional Degree Comparison
Creek
Indonesians
3.1%
PROFESSIONAL DEGREE
0.0/ 100
METRIC RATING
328th/ 347
METRIC RANK
3.7%
PROFESSIONAL DEGREE
1.0/ 100
METRIC RATING
260th/ 347
METRIC RANK
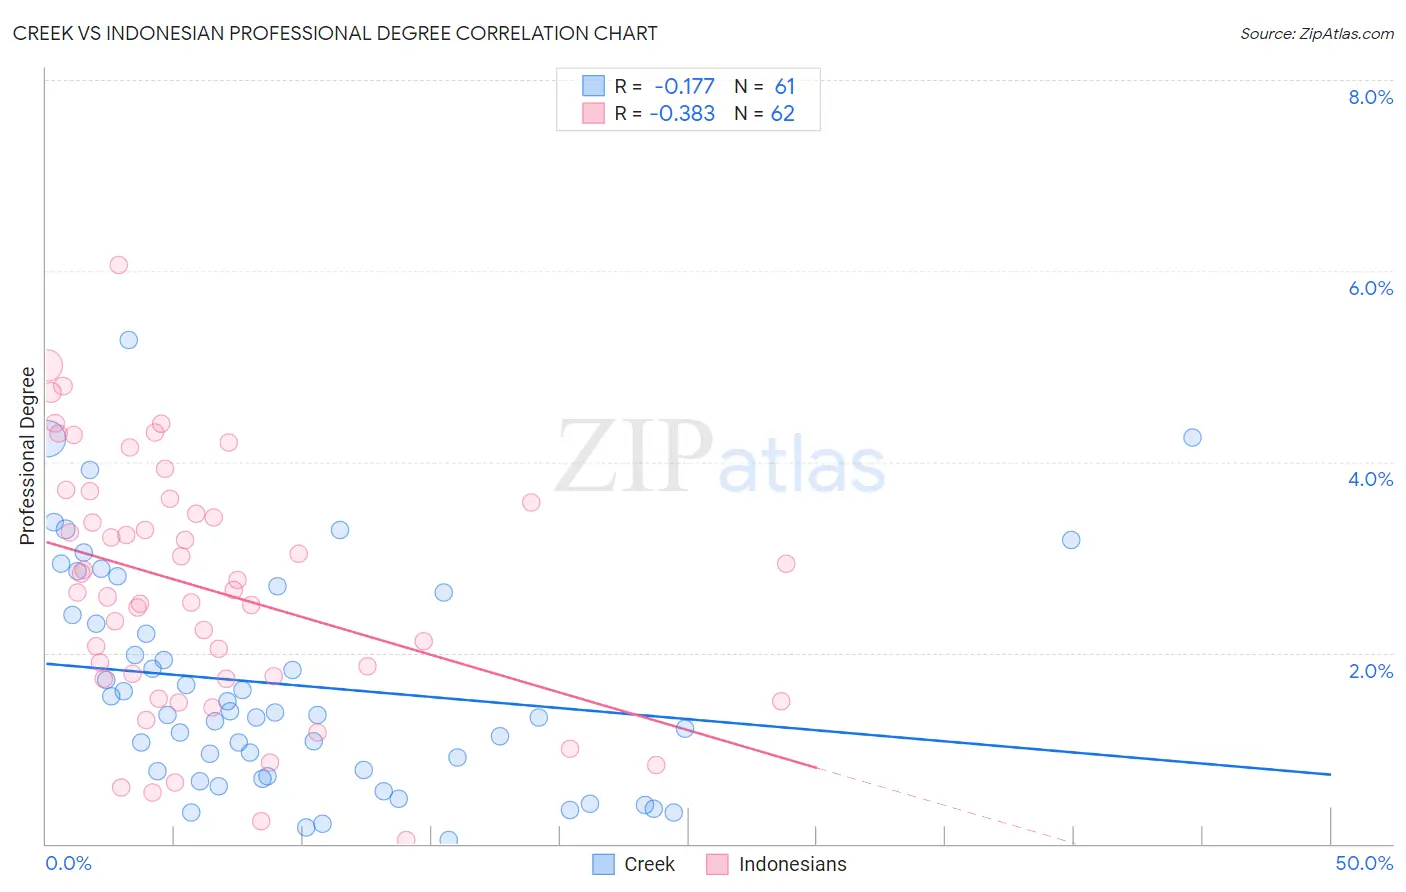
Creek vs Indonesian Professional Degree Correlation Chart
The statistical analysis conducted on geographies consisting of 177,945,536 people shows a poor negative correlation between the proportion of Creek and percentage of population with at least professional degree education in the United States with a correlation coefficient (R) of -0.177 and weighted average of 3.1%. Similarly, the statistical analysis conducted on geographies consisting of 162,566,642 people shows a mild negative correlation between the proportion of Indonesians and percentage of population with at least professional degree education in the United States with a correlation coefficient (R) of -0.383 and weighted average of 3.7%, a difference of 18.6%.
Professional Degree Correlation Summary
| Measurement | Creek | Indonesian |
| Minimum | 0.045% | 0.034% |
| Maximum | 5.3% | 6.1% |
| Range | 5.2% | 6.0% |
| Mean | 1.7% | 2.7% |
| Median | 1.4% | 2.6% |
| Interquartile 25% (IQ1) | 0.73% | 1.7% |
| Interquartile 75% (IQ3) | 2.5% | 3.6% |
| Interquartile Range (IQR) | 1.8% | 1.8% |
| Standard Deviation (Sample) | 1.2% | 1.3% |
| Standard Deviation (Population) | 1.2% | 1.3% |
Similar Demographics by Professional Degree
Demographics Similar to Creek by Professional Degree
In terms of professional degree, the demographic groups most similar to Creek are Dutch West Indian (3.1%, a difference of 0.060%), Menominee (3.1%, a difference of 0.16%), Bangladeshi (3.1%, a difference of 0.21%), Immigrants from Cabo Verde (3.1%, a difference of 0.29%), and Kiowa (3.1%, a difference of 0.41%).
| Demographics | Rating | Rank | Professional Degree |
| Tsimshian | 0.0 /100 | #321 | Tragic 3.2% |
| Hispanics or Latinos | 0.0 /100 | #322 | Tragic 3.2% |
| Inupiat | 0.0 /100 | #323 | Tragic 3.2% |
| Crow | 0.0 /100 | #324 | Tragic 3.2% |
| Yaqui | 0.0 /100 | #325 | Tragic 3.2% |
| Menominee | 0.0 /100 | #326 | Tragic 3.1% |
| Dutch West Indians | 0.0 /100 | #327 | Tragic 3.1% |
| Creek | 0.0 /100 | #328 | Tragic 3.1% |
| Bangladeshis | 0.0 /100 | #329 | Tragic 3.1% |
| Immigrants | Cabo Verde | 0.0 /100 | #330 | Tragic 3.1% |
| Kiowa | 0.0 /100 | #331 | Tragic 3.1% |
| Yakama | 0.0 /100 | #332 | Tragic 3.1% |
| Puget Sound Salish | 0.0 /100 | #333 | Tragic 3.1% |
| Pennsylvania Germans | 0.0 /100 | #334 | Tragic 3.0% |
| Natives/Alaskans | 0.0 /100 | #335 | Tragic 3.0% |
Demographics Similar to Indonesians by Professional Degree
In terms of professional degree, the demographic groups most similar to Indonesians are African (3.7%, a difference of 0.010%), Immigrants from Guyana (3.7%, a difference of 0.18%), U.S. Virgin Islander (3.7%, a difference of 0.19%), Immigrants from St. Vincent and the Grenadines (3.7%, a difference of 0.23%), and Bahamian (3.7%, a difference of 0.31%).
| Demographics | Rating | Rank | Professional Degree |
| Pueblo | 1.4 /100 | #253 | Tragic 3.7% |
| Tongans | 1.3 /100 | #254 | Tragic 3.7% |
| Osage | 1.2 /100 | #255 | Tragic 3.7% |
| Iroquois | 1.2 /100 | #256 | Tragic 3.7% |
| Bahamians | 1.1 /100 | #257 | Tragic 3.7% |
| Immigrants | St. Vincent and the Grenadines | 1.1 /100 | #258 | Tragic 3.7% |
| Africans | 1.0 /100 | #259 | Tragic 3.7% |
| Indonesians | 1.0 /100 | #260 | Tragic 3.7% |
| Immigrants | Guyana | 1.0 /100 | #261 | Tragic 3.7% |
| U.S. Virgin Islanders | 1.0 /100 | #262 | Tragic 3.7% |
| Hopi | 0.9 /100 | #263 | Tragic 3.6% |
| Immigrants | Cambodia | 0.9 /100 | #264 | Tragic 3.6% |
| Immigrants | Congo | 0.8 /100 | #265 | Tragic 3.6% |
| Central American Indians | 0.8 /100 | #266 | Tragic 3.6% |
| Delaware | 0.7 /100 | #267 | Tragic 3.6% |