Immigrants from Belarus vs Laotian Professional Degree
COMPARE
Immigrants from Belarus
Laotian
Professional Degree
Professional Degree Comparison
Immigrants from Belarus
Laotians
5.5%
PROFESSIONAL DEGREE
99.9/ 100
METRIC RATING
62nd/ 347
METRIC RANK
5.2%
PROFESSIONAL DEGREE
99.5/ 100
METRIC RATING
91st/ 347
METRIC RANK
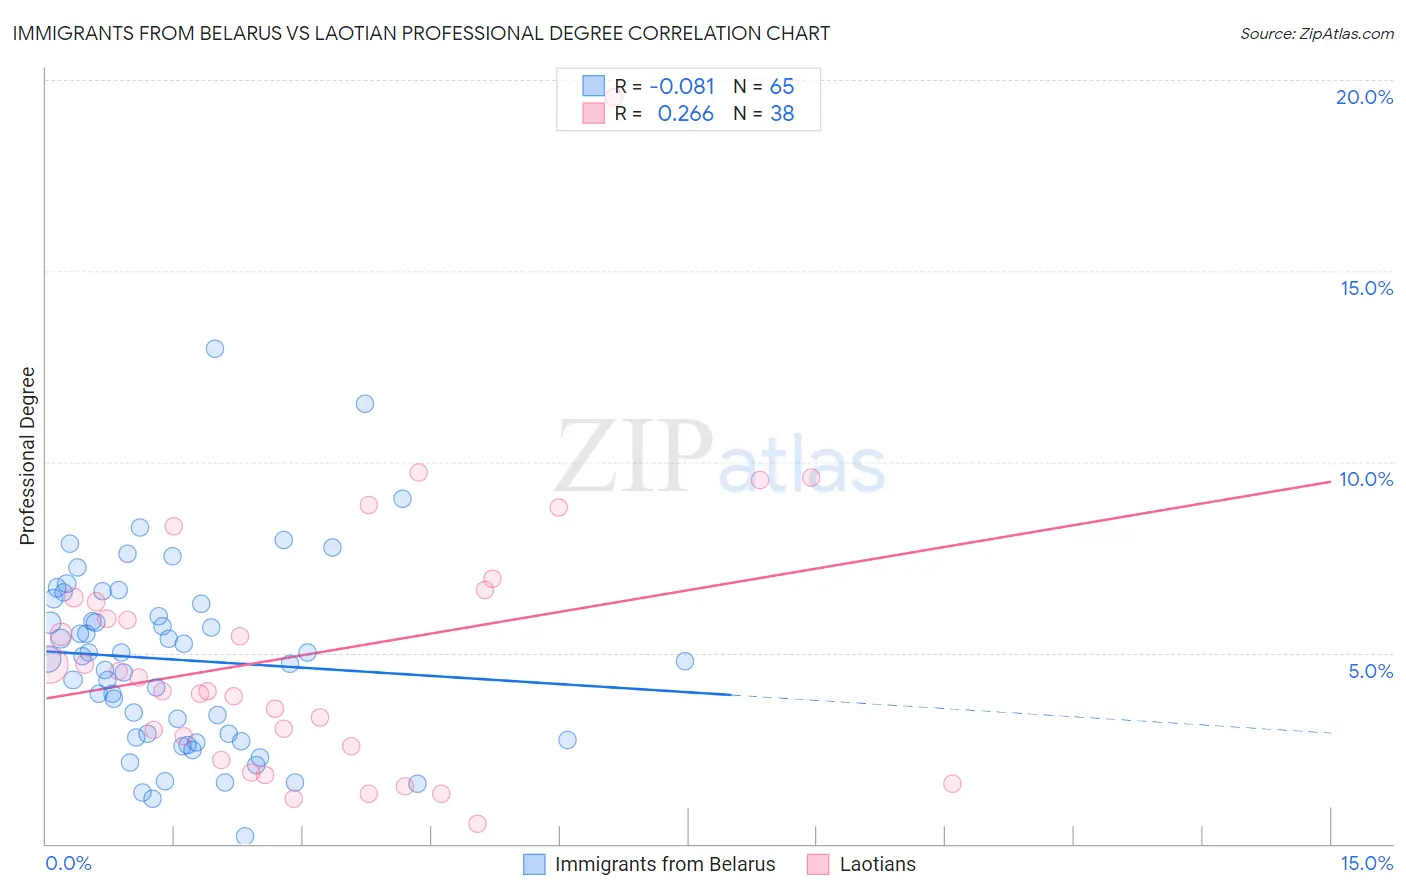
Immigrants from Belarus vs Laotian Professional Degree Correlation Chart
The statistical analysis conducted on geographies consisting of 150,142,268 people shows a slight negative correlation between the proportion of Immigrants from Belarus and percentage of population with at least professional degree education in the United States with a correlation coefficient (R) of -0.081 and weighted average of 5.5%. Similarly, the statistical analysis conducted on geographies consisting of 224,668,924 people shows a weak positive correlation between the proportion of Laotians and percentage of population with at least professional degree education in the United States with a correlation coefficient (R) of 0.266 and weighted average of 5.2%, a difference of 5.5%.
Professional Degree Correlation Summary
| Measurement | Immigrants from Belarus | Laotian |
| Minimum | 0.19% | 0.53% |
| Maximum | 13.0% | 19.5% |
| Range | 12.8% | 19.0% |
| Mean | 4.8% | 5.0% |
| Median | 4.8% | 4.2% |
| Interquartile 25% (IQ1) | 2.8% | 2.6% |
| Interquartile 75% (IQ3) | 6.3% | 6.5% |
| Interquartile Range (IQR) | 3.6% | 3.9% |
| Standard Deviation (Sample) | 2.4% | 3.6% |
| Standard Deviation (Population) | 2.4% | 3.5% |
Similar Demographics by Professional Degree
Demographics Similar to Immigrants from Belarus by Professional Degree
In terms of professional degree, the demographic groups most similar to Immigrants from Belarus are Asian (5.5%, a difference of 0.43%), Immigrants from Asia (5.5%, a difference of 0.49%), Immigrants from Bolivia (5.5%, a difference of 0.56%), Immigrants from Lithuania (5.6%, a difference of 0.76%), and Immigrants from Kazakhstan (5.5%, a difference of 0.79%).
| Demographics | Rating | Rank | Professional Degree |
| Immigrants | Western Europe | 100.0 /100 | #55 | Exceptional 5.7% |
| Immigrants | Malaysia | 100.0 /100 | #56 | Exceptional 5.7% |
| South Africans | 100.0 /100 | #57 | Exceptional 5.7% |
| Bulgarians | 100.0 /100 | #58 | Exceptional 5.7% |
| Immigrants | Europe | 100.0 /100 | #59 | Exceptional 5.6% |
| Bolivians | 99.9 /100 | #60 | Exceptional 5.6% |
| Immigrants | Lithuania | 99.9 /100 | #61 | Exceptional 5.6% |
| Immigrants | Belarus | 99.9 /100 | #62 | Exceptional 5.5% |
| Asians | 99.9 /100 | #63 | Exceptional 5.5% |
| Immigrants | Asia | 99.9 /100 | #64 | Exceptional 5.5% |
| Immigrants | Bolivia | 99.9 /100 | #65 | Exceptional 5.5% |
| Immigrants | Kazakhstan | 99.9 /100 | #66 | Exceptional 5.5% |
| Immigrants | Bulgaria | 99.9 /100 | #67 | Exceptional 5.5% |
| Immigrants | Lebanon | 99.9 /100 | #68 | Exceptional 5.5% |
| Immigrants | Hungary | 99.9 /100 | #69 | Exceptional 5.5% |
Demographics Similar to Laotians by Professional Degree
In terms of professional degree, the demographic groups most similar to Laotians are Immigrants from Eastern Europe (5.2%, a difference of 0.040%), Immigrants from Scotland (5.3%, a difference of 0.16%), Chilean (5.3%, a difference of 0.26%), Egyptian (5.3%, a difference of 0.27%), and Immigrants from Chile (5.3%, a difference of 0.41%).
| Demographics | Rating | Rank | Professional Degree |
| Immigrants | Croatia | 99.6 /100 | #84 | Exceptional 5.3% |
| Immigrants | Zimbabwe | 99.6 /100 | #85 | Exceptional 5.3% |
| Greeks | 99.6 /100 | #86 | Exceptional 5.3% |
| Immigrants | Chile | 99.5 /100 | #87 | Exceptional 5.3% |
| Egyptians | 99.5 /100 | #88 | Exceptional 5.3% |
| Chileans | 99.5 /100 | #89 | Exceptional 5.3% |
| Immigrants | Scotland | 99.5 /100 | #90 | Exceptional 5.3% |
| Laotians | 99.5 /100 | #91 | Exceptional 5.2% |
| Immigrants | Eastern Europe | 99.5 /100 | #92 | Exceptional 5.2% |
| Northern Europeans | 99.3 /100 | #93 | Exceptional 5.2% |
| Alsatians | 99.3 /100 | #94 | Exceptional 5.2% |
| Zimbabweans | 99.3 /100 | #95 | Exceptional 5.2% |
| Immigrants | Uzbekistan | 99.2 /100 | #96 | Exceptional 5.2% |
| Syrians | 99.1 /100 | #97 | Exceptional 5.2% |
| Austrians | 99.1 /100 | #98 | Exceptional 5.2% |