Creek vs Liberian Professional Degree
COMPARE
Creek
Liberian
Professional Degree
Professional Degree Comparison
Creek
Liberians
3.1%
PROFESSIONAL DEGREE
0.0/ 100
METRIC RATING
328th/ 347
METRIC RANK
3.6%
PROFESSIONAL DEGREE
0.5/ 100
METRIC RATING
276th/ 347
METRIC RANK
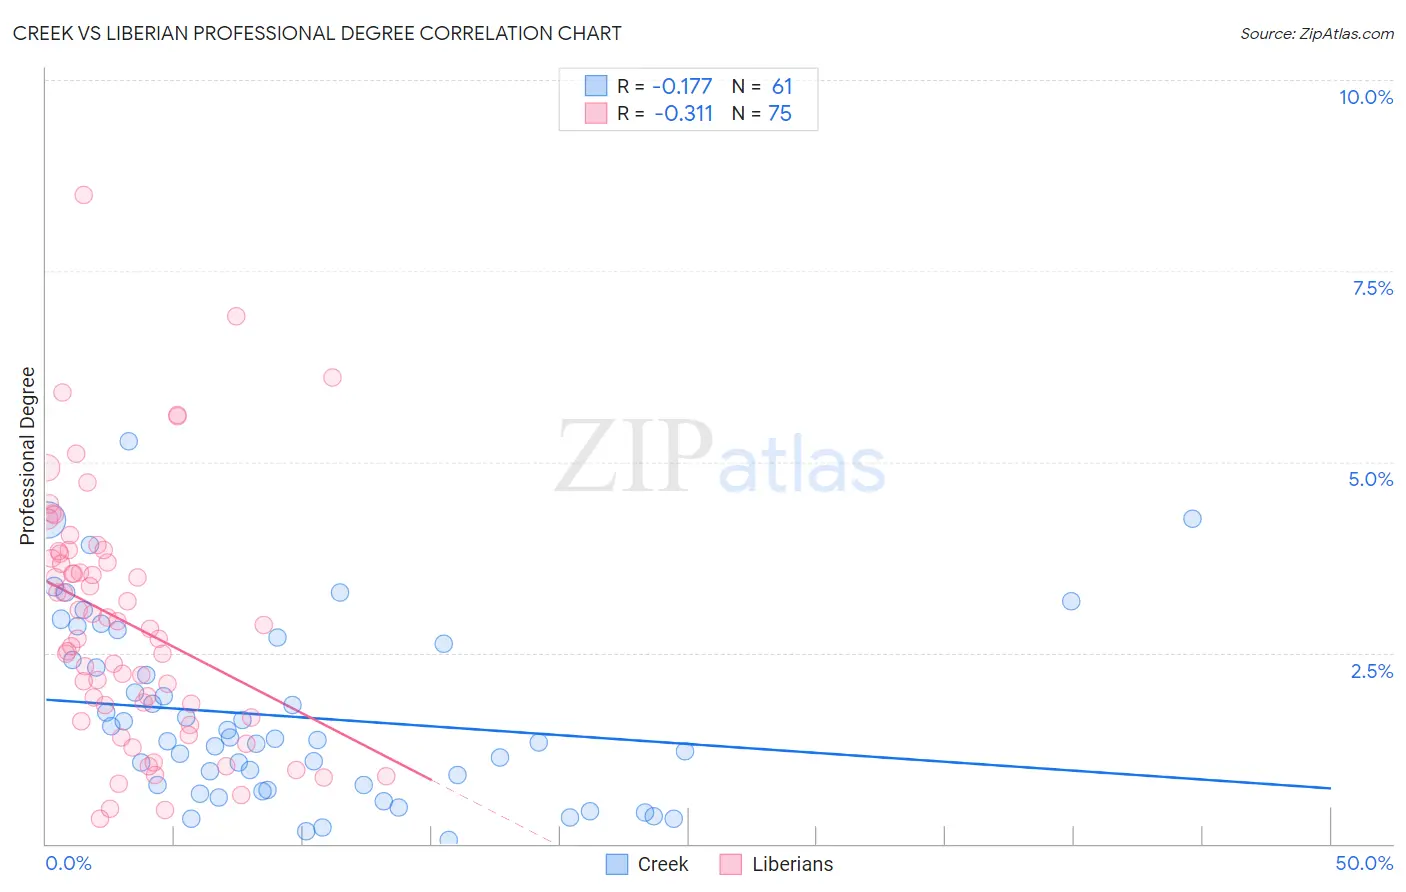
Creek vs Liberian Professional Degree Correlation Chart
The statistical analysis conducted on geographies consisting of 177,945,536 people shows a poor negative correlation between the proportion of Creek and percentage of population with at least professional degree education in the United States with a correlation coefficient (R) of -0.177 and weighted average of 3.1%. Similarly, the statistical analysis conducted on geographies consisting of 117,941,180 people shows a mild negative correlation between the proportion of Liberians and percentage of population with at least professional degree education in the United States with a correlation coefficient (R) of -0.311 and weighted average of 3.6%, a difference of 14.7%.
Professional Degree Correlation Summary
| Measurement | Creek | Liberian |
| Minimum | 0.045% | 0.33% |
| Maximum | 5.3% | 8.5% |
| Range | 5.2% | 8.2% |
| Mean | 1.7% | 2.9% |
| Median | 1.4% | 2.8% |
| Interquartile 25% (IQ1) | 0.73% | 1.7% |
| Interquartile 75% (IQ3) | 2.5% | 3.8% |
| Interquartile Range (IQR) | 1.8% | 2.1% |
| Standard Deviation (Sample) | 1.2% | 1.6% |
| Standard Deviation (Population) | 1.2% | 1.6% |
Similar Demographics by Professional Degree
Demographics Similar to Creek by Professional Degree
In terms of professional degree, the demographic groups most similar to Creek are Dutch West Indian (3.1%, a difference of 0.060%), Menominee (3.1%, a difference of 0.16%), Bangladeshi (3.1%, a difference of 0.21%), Immigrants from Cabo Verde (3.1%, a difference of 0.29%), and Kiowa (3.1%, a difference of 0.41%).
| Demographics | Rating | Rank | Professional Degree |
| Tsimshian | 0.0 /100 | #321 | Tragic 3.2% |
| Hispanics or Latinos | 0.0 /100 | #322 | Tragic 3.2% |
| Inupiat | 0.0 /100 | #323 | Tragic 3.2% |
| Crow | 0.0 /100 | #324 | Tragic 3.2% |
| Yaqui | 0.0 /100 | #325 | Tragic 3.2% |
| Menominee | 0.0 /100 | #326 | Tragic 3.1% |
| Dutch West Indians | 0.0 /100 | #327 | Tragic 3.1% |
| Creek | 0.0 /100 | #328 | Tragic 3.1% |
| Bangladeshis | 0.0 /100 | #329 | Tragic 3.1% |
| Immigrants | Cabo Verde | 0.0 /100 | #330 | Tragic 3.1% |
| Kiowa | 0.0 /100 | #331 | Tragic 3.1% |
| Yakama | 0.0 /100 | #332 | Tragic 3.1% |
| Puget Sound Salish | 0.0 /100 | #333 | Tragic 3.1% |
| Pennsylvania Germans | 0.0 /100 | #334 | Tragic 3.0% |
| Natives/Alaskans | 0.0 /100 | #335 | Tragic 3.0% |
Demographics Similar to Liberians by Professional Degree
In terms of professional degree, the demographic groups most similar to Liberians are Cheyenne (3.6%, a difference of 0.010%), Immigrants from Dominica (3.6%, a difference of 0.050%), Japanese (3.5%, a difference of 0.070%), Immigrants from Portugal (3.5%, a difference of 0.11%), and Dominican (3.5%, a difference of 0.15%).
| Demographics | Rating | Rank | Professional Degree |
| Immigrants | Cuba | 0.6 /100 | #269 | Tragic 3.6% |
| Central Americans | 0.6 /100 | #270 | Tragic 3.6% |
| Belizeans | 0.5 /100 | #271 | Tragic 3.6% |
| Immigrants | Jamaica | 0.5 /100 | #272 | Tragic 3.6% |
| Americans | 0.5 /100 | #273 | Tragic 3.6% |
| Potawatomi | 0.5 /100 | #274 | Tragic 3.6% |
| Immigrants | Dominica | 0.5 /100 | #275 | Tragic 3.6% |
| Liberians | 0.5 /100 | #276 | Tragic 3.6% |
| Cheyenne | 0.5 /100 | #277 | Tragic 3.6% |
| Japanese | 0.5 /100 | #278 | Tragic 3.5% |
| Immigrants | Portugal | 0.5 /100 | #279 | Tragic 3.5% |
| Dominicans | 0.5 /100 | #280 | Tragic 3.5% |
| Apache | 0.5 /100 | #281 | Tragic 3.5% |
| Immigrants | Caribbean | 0.5 /100 | #282 | Tragic 3.5% |
| Comanche | 0.4 /100 | #283 | Tragic 3.5% |