German Russian vs Laotian Professional Degree
COMPARE
German Russian
Laotian
Professional Degree
Professional Degree Comparison
German Russians
Laotians
4.0%
PROFESSIONAL DEGREE
6.1/ 100
METRIC RATING
226th/ 347
METRIC RANK
5.2%
PROFESSIONAL DEGREE
99.5/ 100
METRIC RATING
91st/ 347
METRIC RANK
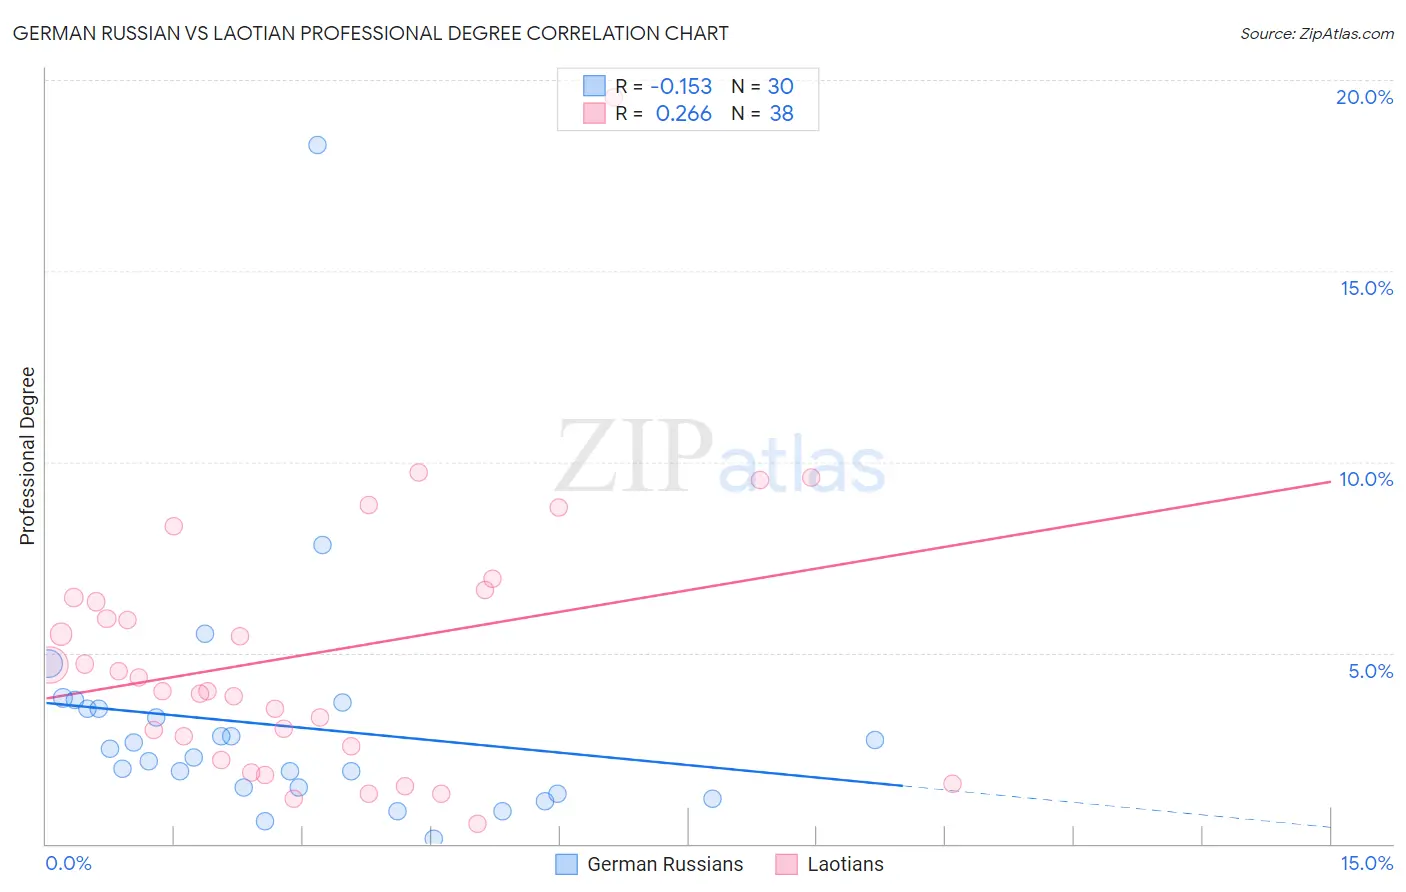
German Russian vs Laotian Professional Degree Correlation Chart
The statistical analysis conducted on geographies consisting of 96,360,992 people shows a poor negative correlation between the proportion of German Russians and percentage of population with at least professional degree education in the United States with a correlation coefficient (R) of -0.153 and weighted average of 4.0%. Similarly, the statistical analysis conducted on geographies consisting of 224,668,924 people shows a weak positive correlation between the proportion of Laotians and percentage of population with at least professional degree education in the United States with a correlation coefficient (R) of 0.266 and weighted average of 5.2%, a difference of 32.1%.
Professional Degree Correlation Summary
| Measurement | German Russian | Laotian |
| Minimum | 0.15% | 0.53% |
| Maximum | 18.3% | 19.5% |
| Range | 18.2% | 19.0% |
| Mean | 3.1% | 5.0% |
| Median | 2.4% | 4.2% |
| Interquartile 25% (IQ1) | 1.5% | 2.6% |
| Interquartile 75% (IQ3) | 3.6% | 6.5% |
| Interquartile Range (IQR) | 2.1% | 3.9% |
| Standard Deviation (Sample) | 3.3% | 3.6% |
| Standard Deviation (Population) | 3.2% | 3.5% |
Similar Demographics by Professional Degree
Demographics Similar to German Russians by Professional Degree
In terms of professional degree, the demographic groups most similar to German Russians are Cuban (4.0%, a difference of 0.12%), Immigrants from West Indies (4.0%, a difference of 0.37%), Immigrants from Burma/Myanmar (3.9%, a difference of 0.52%), Tlingit-Haida (4.0%, a difference of 0.55%), and Trinidadian and Tobagonian (4.0%, a difference of 0.68%).
| Demographics | Rating | Rank | Professional Degree |
| Immigrants | South Eastern Asia | 8.9 /100 | #219 | Tragic 4.0% |
| Ute | 8.2 /100 | #220 | Tragic 4.0% |
| French Canadians | 8.0 /100 | #221 | Tragic 4.0% |
| Immigrants | Western Africa | 7.5 /100 | #222 | Tragic 4.0% |
| Immigrants | Bosnia and Herzegovina | 7.4 /100 | #223 | Tragic 4.0% |
| Trinidadians and Tobagonians | 7.1 /100 | #224 | Tragic 4.0% |
| Tlingit-Haida | 6.9 /100 | #225 | Tragic 4.0% |
| German Russians | 6.1 /100 | #226 | Tragic 4.0% |
| Cubans | 5.9 /100 | #227 | Tragic 4.0% |
| Immigrants | West Indies | 5.6 /100 | #228 | Tragic 4.0% |
| Immigrants | Burma/Myanmar | 5.4 /100 | #229 | Tragic 3.9% |
| Nicaraguans | 5.1 /100 | #230 | Tragic 3.9% |
| Ecuadorians | 4.6 /100 | #231 | Tragic 3.9% |
| Cree | 4.3 /100 | #232 | Tragic 3.9% |
| Immigrants | Philippines | 4.1 /100 | #233 | Tragic 3.9% |
Demographics Similar to Laotians by Professional Degree
In terms of professional degree, the demographic groups most similar to Laotians are Immigrants from Eastern Europe (5.2%, a difference of 0.040%), Immigrants from Scotland (5.3%, a difference of 0.16%), Chilean (5.3%, a difference of 0.26%), Egyptian (5.3%, a difference of 0.27%), and Immigrants from Chile (5.3%, a difference of 0.41%).
| Demographics | Rating | Rank | Professional Degree |
| Immigrants | Croatia | 99.6 /100 | #84 | Exceptional 5.3% |
| Immigrants | Zimbabwe | 99.6 /100 | #85 | Exceptional 5.3% |
| Greeks | 99.6 /100 | #86 | Exceptional 5.3% |
| Immigrants | Chile | 99.5 /100 | #87 | Exceptional 5.3% |
| Egyptians | 99.5 /100 | #88 | Exceptional 5.3% |
| Chileans | 99.5 /100 | #89 | Exceptional 5.3% |
| Immigrants | Scotland | 99.5 /100 | #90 | Exceptional 5.3% |
| Laotians | 99.5 /100 | #91 | Exceptional 5.2% |
| Immigrants | Eastern Europe | 99.5 /100 | #92 | Exceptional 5.2% |
| Northern Europeans | 99.3 /100 | #93 | Exceptional 5.2% |
| Alsatians | 99.3 /100 | #94 | Exceptional 5.2% |
| Zimbabweans | 99.3 /100 | #95 | Exceptional 5.2% |
| Immigrants | Uzbekistan | 99.2 /100 | #96 | Exceptional 5.2% |
| Syrians | 99.1 /100 | #97 | Exceptional 5.2% |
| Austrians | 99.1 /100 | #98 | Exceptional 5.2% |