Creek vs British West Indian No Schooling Completed
COMPARE
Creek
British West Indian
No Schooling Completed
No Schooling Completed Comparison
Creek
British West Indians
1.6%
NO SCHOOLING COMPLETED
99.8/ 100
METRIC RATING
53rd/ 347
METRIC RANK
2.7%
NO SCHOOLING COMPLETED
0.0/ 100
METRIC RATING
291st/ 347
METRIC RANK
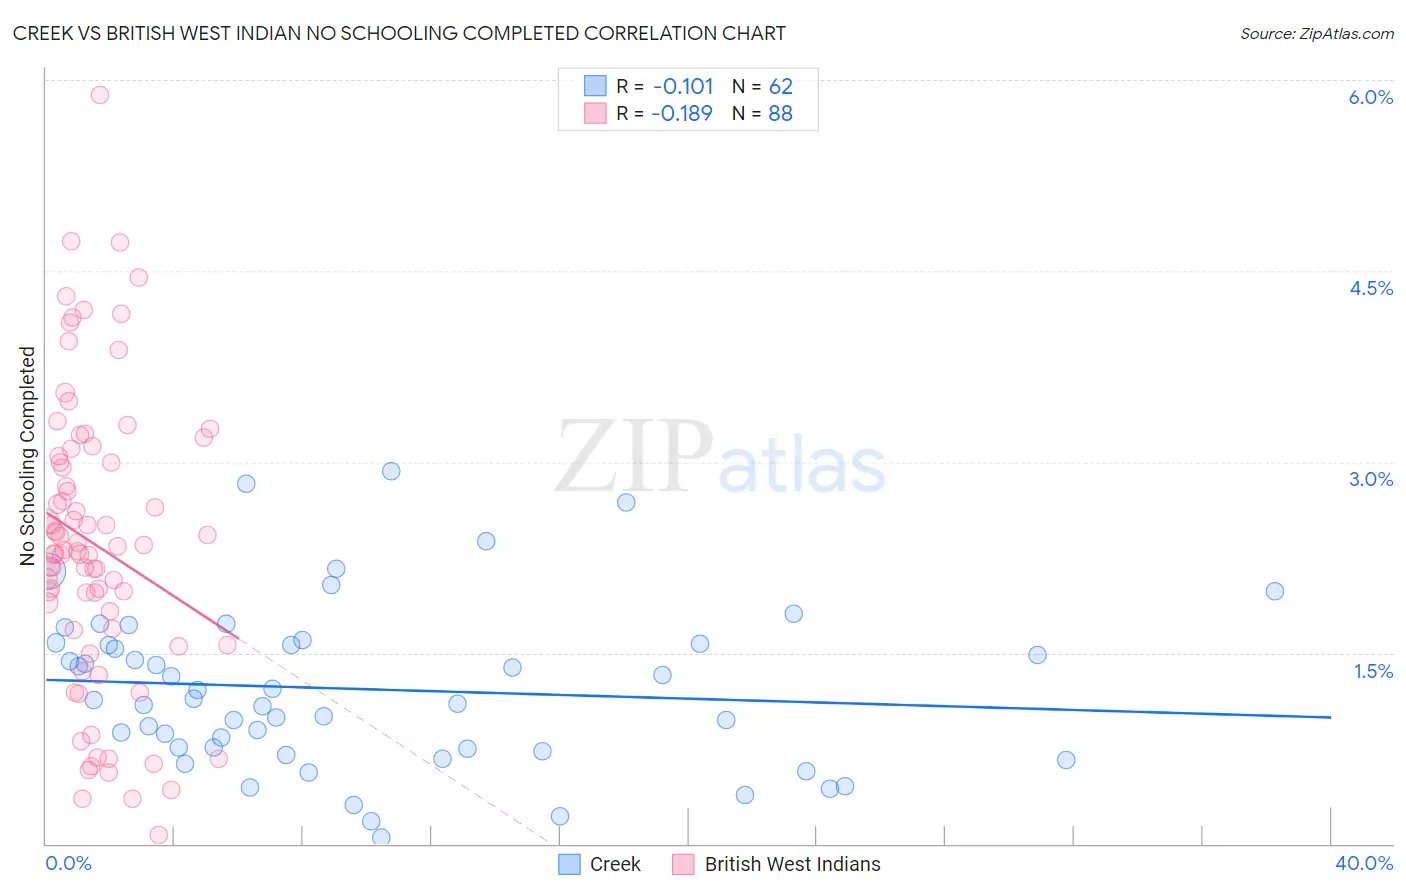
Creek vs British West Indian No Schooling Completed Correlation Chart
The statistical analysis conducted on geographies consisting of 177,524,954 people shows a poor negative correlation between the proportion of Creek and percentage of population with no schooling in the United States with a correlation coefficient (R) of -0.101 and weighted average of 1.6%. Similarly, the statistical analysis conducted on geographies consisting of 152,295,928 people shows a poor negative correlation between the proportion of British West Indians and percentage of population with no schooling in the United States with a correlation coefficient (R) of -0.189 and weighted average of 2.7%, a difference of 66.4%.
No Schooling Completed Correlation Summary
| Measurement | Creek | British West Indian |
| Minimum | 0.049% | 0.065% |
| Maximum | 2.9% | 5.9% |
| Range | 2.9% | 5.8% |
| Mean | 1.2% | 2.4% |
| Median | 1.1% | 2.3% |
| Interquartile 25% (IQ1) | 0.74% | 1.7% |
| Interquartile 75% (IQ3) | 1.6% | 3.0% |
| Interquartile Range (IQR) | 0.82% | 1.3% |
| Standard Deviation (Sample) | 0.64% | 1.1% |
| Standard Deviation (Population) | 0.64% | 1.1% |
Similar Demographics by No Schooling Completed
Demographics Similar to Creek by No Schooling Completed
In terms of no schooling completed, the demographic groups most similar to Creek are Crow (1.6%, a difference of 0.030%), Immigrants from Canada (1.6%, a difference of 0.13%), Greek (1.6%, a difference of 0.15%), Immigrants from North America (1.6%, a difference of 0.15%), and Chippewa (1.6%, a difference of 0.20%).
| Demographics | Rating | Rank | No Schooling Completed |
| Maltese | 99.9 /100 | #46 | Exceptional 1.6% |
| Ottawa | 99.9 /100 | #47 | Exceptional 1.6% |
| Immigrants | Scotland | 99.9 /100 | #48 | Exceptional 1.6% |
| Whites/Caucasians | 99.9 /100 | #49 | Exceptional 1.6% |
| Celtics | 99.9 /100 | #50 | Exceptional 1.6% |
| Chippewa | 99.8 /100 | #51 | Exceptional 1.6% |
| Immigrants | Canada | 99.8 /100 | #52 | Exceptional 1.6% |
| Creek | 99.8 /100 | #53 | Exceptional 1.6% |
| Crow | 99.8 /100 | #54 | Exceptional 1.6% |
| Greeks | 99.8 /100 | #55 | Exceptional 1.6% |
| Immigrants | North America | 99.8 /100 | #56 | Exceptional 1.6% |
| Austrians | 99.8 /100 | #57 | Exceptional 1.6% |
| Kiowa | 99.8 /100 | #58 | Exceptional 1.6% |
| Slavs | 99.8 /100 | #59 | Exceptional 1.7% |
| Americans | 99.8 /100 | #60 | Exceptional 1.7% |
Demographics Similar to British West Indians by No Schooling Completed
In terms of no schooling completed, the demographic groups most similar to British West Indians are Immigrants from Hong Kong (2.7%, a difference of 0.89%), Immigrants from Thailand (2.7%, a difference of 0.95%), Immigrants from Grenada (2.8%, a difference of 1.1%), Immigrants from St. Vincent and the Grenadines (2.7%, a difference of 1.3%), and Immigrants from Afghanistan (2.7%, a difference of 1.4%).
| Demographics | Rating | Rank | No Schooling Completed |
| Immigrants | West Indies | 0.0 /100 | #284 | Tragic 2.7% |
| Immigrants | Barbados | 0.0 /100 | #285 | Tragic 2.7% |
| Immigrants | Portugal | 0.0 /100 | #286 | Tragic 2.7% |
| Immigrants | Afghanistan | 0.0 /100 | #287 | Tragic 2.7% |
| Immigrants | St. Vincent and the Grenadines | 0.0 /100 | #288 | Tragic 2.7% |
| Immigrants | Thailand | 0.0 /100 | #289 | Tragic 2.7% |
| Immigrants | Hong Kong | 0.0 /100 | #290 | Tragic 2.7% |
| British West Indians | 0.0 /100 | #291 | Tragic 2.7% |
| Immigrants | Grenada | 0.0 /100 | #292 | Tragic 2.8% |
| Malaysians | 0.0 /100 | #293 | Tragic 2.8% |
| Immigrants | Eritrea | 0.0 /100 | #294 | Tragic 2.8% |
| Houma | 0.0 /100 | #295 | Tragic 2.8% |
| Immigrants | Immigrants | 0.0 /100 | #296 | Tragic 2.8% |
| Immigrants | Cuba | 0.0 /100 | #297 | Tragic 2.8% |
| Immigrants | Dominica | 0.0 /100 | #298 | Tragic 2.8% |