Creek vs Immigrants from Indonesia No Schooling Completed
COMPARE
Creek
Immigrants from Indonesia
No Schooling Completed
No Schooling Completed Comparison
Creek
Immigrants from Indonesia
1.6%
NO SCHOOLING COMPLETED
99.8/ 100
METRIC RATING
53rd/ 347
METRIC RANK
2.4%
NO SCHOOLING COMPLETED
1.5/ 100
METRIC RATING
242nd/ 347
METRIC RANK
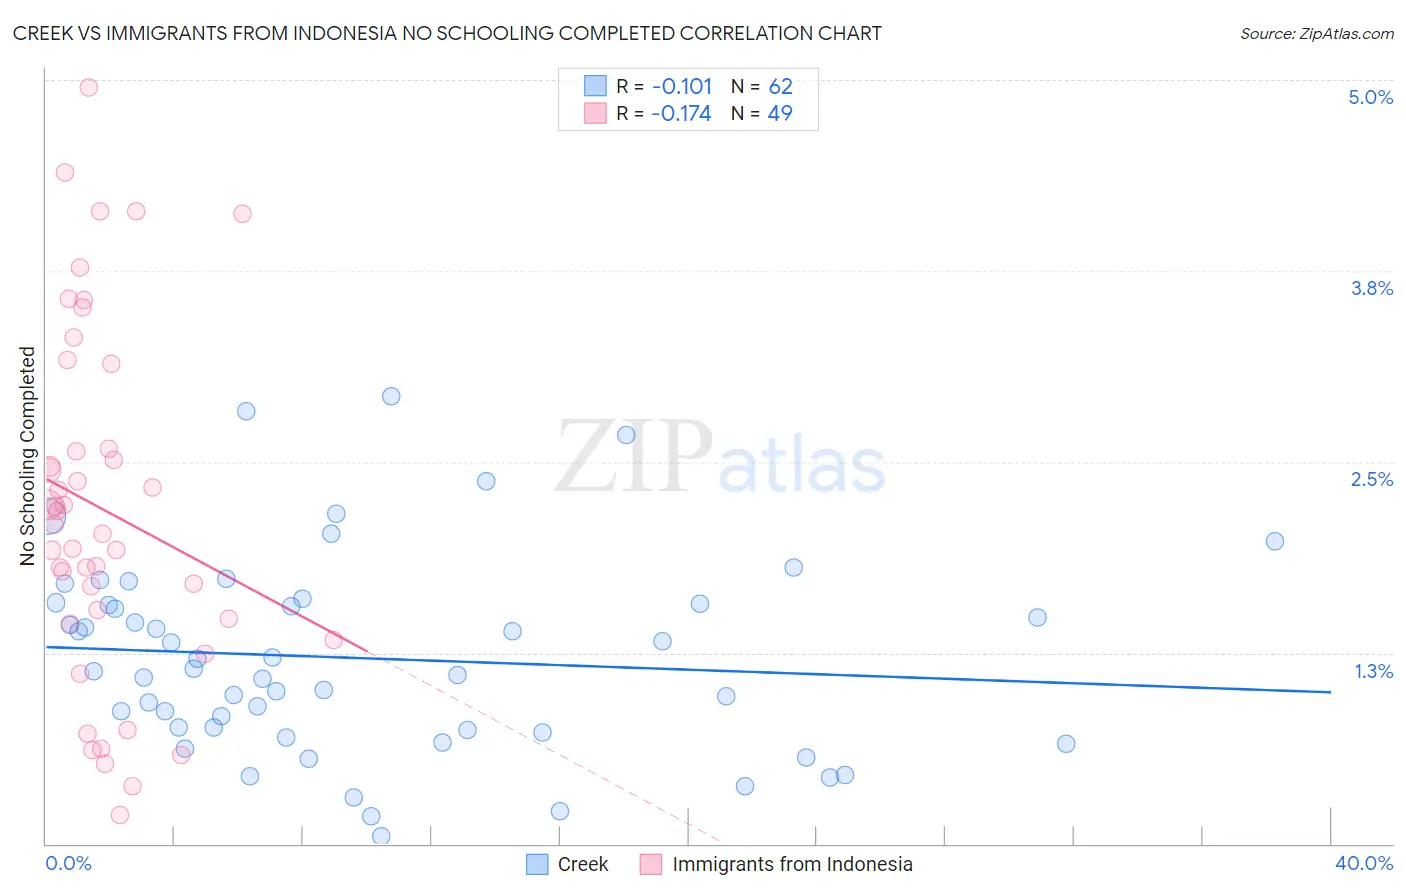
Creek vs Immigrants from Indonesia No Schooling Completed Correlation Chart
The statistical analysis conducted on geographies consisting of 177,524,954 people shows a poor negative correlation between the proportion of Creek and percentage of population with no schooling in the United States with a correlation coefficient (R) of -0.101 and weighted average of 1.6%. Similarly, the statistical analysis conducted on geographies consisting of 214,703,374 people shows a poor negative correlation between the proportion of Immigrants from Indonesia and percentage of population with no schooling in the United States with a correlation coefficient (R) of -0.174 and weighted average of 2.4%, a difference of 45.5%.
No Schooling Completed Correlation Summary
| Measurement | Creek | Immigrants from Indonesia |
| Minimum | 0.049% | 0.18% |
| Maximum | 2.9% | 4.9% |
| Range | 2.9% | 4.8% |
| Mean | 1.2% | 2.2% |
| Median | 1.1% | 2.1% |
| Interquartile 25% (IQ1) | 0.74% | 1.5% |
| Interquartile 75% (IQ3) | 1.6% | 2.9% |
| Interquartile Range (IQR) | 0.82% | 1.4% |
| Standard Deviation (Sample) | 0.64% | 1.1% |
| Standard Deviation (Population) | 0.64% | 1.1% |
Similar Demographics by No Schooling Completed
Demographics Similar to Creek by No Schooling Completed
In terms of no schooling completed, the demographic groups most similar to Creek are Crow (1.6%, a difference of 0.030%), Immigrants from Canada (1.6%, a difference of 0.13%), Greek (1.6%, a difference of 0.15%), Immigrants from North America (1.6%, a difference of 0.15%), and Chippewa (1.6%, a difference of 0.20%).
| Demographics | Rating | Rank | No Schooling Completed |
| Maltese | 99.9 /100 | #46 | Exceptional 1.6% |
| Ottawa | 99.9 /100 | #47 | Exceptional 1.6% |
| Immigrants | Scotland | 99.9 /100 | #48 | Exceptional 1.6% |
| Whites/Caucasians | 99.9 /100 | #49 | Exceptional 1.6% |
| Celtics | 99.9 /100 | #50 | Exceptional 1.6% |
| Chippewa | 99.8 /100 | #51 | Exceptional 1.6% |
| Immigrants | Canada | 99.8 /100 | #52 | Exceptional 1.6% |
| Creek | 99.8 /100 | #53 | Exceptional 1.6% |
| Crow | 99.8 /100 | #54 | Exceptional 1.6% |
| Greeks | 99.8 /100 | #55 | Exceptional 1.6% |
| Immigrants | North America | 99.8 /100 | #56 | Exceptional 1.6% |
| Austrians | 99.8 /100 | #57 | Exceptional 1.6% |
| Kiowa | 99.8 /100 | #58 | Exceptional 1.6% |
| Slavs | 99.8 /100 | #59 | Exceptional 1.7% |
| Americans | 99.8 /100 | #60 | Exceptional 1.7% |
Demographics Similar to Immigrants from Indonesia by No Schooling Completed
In terms of no schooling completed, the demographic groups most similar to Immigrants from Indonesia are South American (2.4%, a difference of 0.040%), Peruvian (2.4%, a difference of 0.14%), Bolivian (2.4%, a difference of 0.15%), Immigrants from Congo (2.4%, a difference of 0.20%), and Immigrants from Iraq (2.4%, a difference of 0.30%).
| Demographics | Rating | Rank | No Schooling Completed |
| Immigrants | Western Asia | 2.6 /100 | #235 | Tragic 2.3% |
| Iraqis | 2.2 /100 | #236 | Tragic 2.4% |
| Immigrants | Eastern Asia | 2.0 /100 | #237 | Tragic 2.4% |
| Paiute | 1.9 /100 | #238 | Tragic 2.4% |
| Liberians | 1.8 /100 | #239 | Tragic 2.4% |
| Immigrants | Senegal | 1.7 /100 | #240 | Tragic 2.4% |
| Koreans | 1.7 /100 | #241 | Tragic 2.4% |
| Immigrants | Indonesia | 1.5 /100 | #242 | Tragic 2.4% |
| South Americans | 1.5 /100 | #243 | Tragic 2.4% |
| Peruvians | 1.4 /100 | #244 | Tragic 2.4% |
| Bolivians | 1.4 /100 | #245 | Tragic 2.4% |
| Immigrants | Congo | 1.4 /100 | #246 | Tragic 2.4% |
| Immigrants | Iraq | 1.3 /100 | #247 | Tragic 2.4% |
| Asians | 1.2 /100 | #248 | Tragic 2.4% |
| Jamaicans | 1.2 /100 | #249 | Tragic 2.4% |