Creek vs Immigrants from Kazakhstan No Schooling Completed
COMPARE
Creek
Immigrants from Kazakhstan
No Schooling Completed
No Schooling Completed Comparison
Creek
Immigrants from Kazakhstan
1.6%
NO SCHOOLING COMPLETED
99.8/ 100
METRIC RATING
53rd/ 347
METRIC RANK
2.1%
NO SCHOOLING COMPLETED
44.3/ 100
METRIC RATING
179th/ 347
METRIC RANK
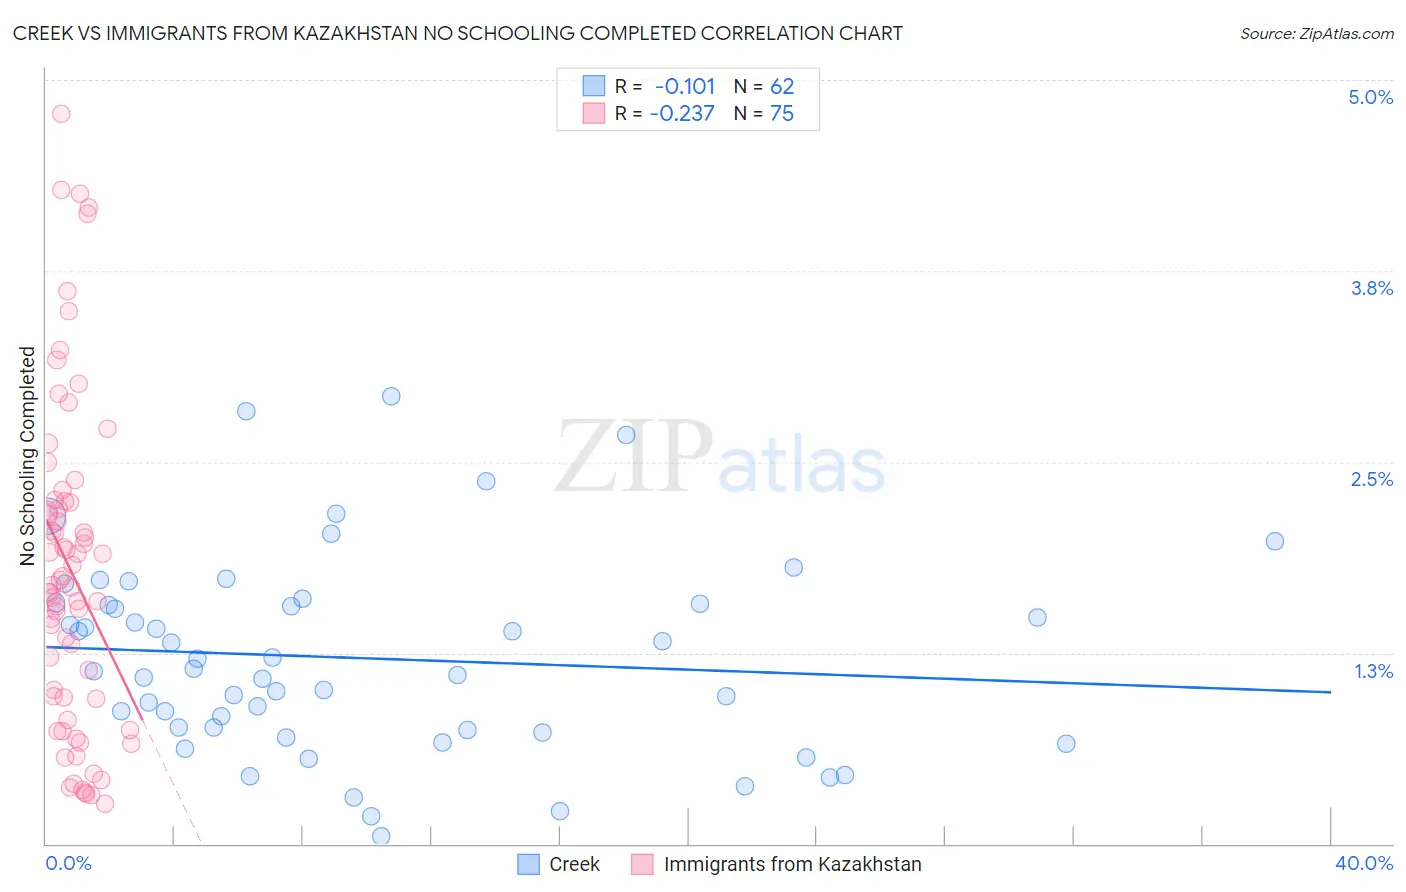
Creek vs Immigrants from Kazakhstan No Schooling Completed Correlation Chart
The statistical analysis conducted on geographies consisting of 177,524,954 people shows a poor negative correlation between the proportion of Creek and percentage of population with no schooling in the United States with a correlation coefficient (R) of -0.101 and weighted average of 1.6%. Similarly, the statistical analysis conducted on geographies consisting of 123,956,423 people shows a weak negative correlation between the proportion of Immigrants from Kazakhstan and percentage of population with no schooling in the United States with a correlation coefficient (R) of -0.237 and weighted average of 2.1%, a difference of 28.6%.
No Schooling Completed Correlation Summary
| Measurement | Creek | Immigrants from Kazakhstan |
| Minimum | 0.049% | 0.26% |
| Maximum | 2.9% | 4.8% |
| Range | 2.9% | 4.5% |
| Mean | 1.2% | 1.8% |
| Median | 1.1% | 1.7% |
| Interquartile 25% (IQ1) | 0.74% | 0.95% |
| Interquartile 75% (IQ3) | 1.6% | 2.2% |
| Interquartile Range (IQR) | 0.82% | 1.3% |
| Standard Deviation (Sample) | 0.64% | 1.1% |
| Standard Deviation (Population) | 0.64% | 1.1% |
Similar Demographics by No Schooling Completed
Demographics Similar to Creek by No Schooling Completed
In terms of no schooling completed, the demographic groups most similar to Creek are Crow (1.6%, a difference of 0.030%), Immigrants from Canada (1.6%, a difference of 0.13%), Greek (1.6%, a difference of 0.15%), Immigrants from North America (1.6%, a difference of 0.15%), and Chippewa (1.6%, a difference of 0.20%).
| Demographics | Rating | Rank | No Schooling Completed |
| Maltese | 99.9 /100 | #46 | Exceptional 1.6% |
| Ottawa | 99.9 /100 | #47 | Exceptional 1.6% |
| Immigrants | Scotland | 99.9 /100 | #48 | Exceptional 1.6% |
| Whites/Caucasians | 99.9 /100 | #49 | Exceptional 1.6% |
| Celtics | 99.9 /100 | #50 | Exceptional 1.6% |
| Chippewa | 99.8 /100 | #51 | Exceptional 1.6% |
| Immigrants | Canada | 99.8 /100 | #52 | Exceptional 1.6% |
| Creek | 99.8 /100 | #53 | Exceptional 1.6% |
| Crow | 99.8 /100 | #54 | Exceptional 1.6% |
| Greeks | 99.8 /100 | #55 | Exceptional 1.6% |
| Immigrants | North America | 99.8 /100 | #56 | Exceptional 1.6% |
| Austrians | 99.8 /100 | #57 | Exceptional 1.6% |
| Kiowa | 99.8 /100 | #58 | Exceptional 1.6% |
| Slavs | 99.8 /100 | #59 | Exceptional 1.7% |
| Americans | 99.8 /100 | #60 | Exceptional 1.7% |
Demographics Similar to Immigrants from Kazakhstan by No Schooling Completed
In terms of no schooling completed, the demographic groups most similar to Immigrants from Kazakhstan are Pakistani (2.1%, a difference of 0.050%), Portuguese (2.1%, a difference of 0.060%), Arapaho (2.1%, a difference of 0.10%), Panamanian (2.1%, a difference of 0.11%), and Immigrants from Taiwan (2.1%, a difference of 0.24%).
| Demographics | Rating | Rank | No Schooling Completed |
| Immigrants | Argentina | 52.7 /100 | #172 | Average 2.1% |
| Immigrants | Belarus | 51.8 /100 | #173 | Average 2.1% |
| Immigrants | Micronesia | 50.0 /100 | #174 | Average 2.1% |
| Arabs | 46.4 /100 | #175 | Average 2.1% |
| Panamanians | 45.2 /100 | #176 | Average 2.1% |
| Arapaho | 45.0 /100 | #177 | Average 2.1% |
| Pakistanis | 44.7 /100 | #178 | Average 2.1% |
| Immigrants | Kazakhstan | 44.3 /100 | #179 | Average 2.1% |
| Portuguese | 43.9 /100 | #180 | Average 2.1% |
| Immigrants | Taiwan | 42.6 /100 | #181 | Average 2.1% |
| French American Indians | 42.2 /100 | #182 | Average 2.1% |
| Blacks/African Americans | 41.4 /100 | #183 | Average 2.1% |
| Pima | 41.3 /100 | #184 | Average 2.1% |
| Mongolians | 40.8 /100 | #185 | Average 2.1% |
| Immigrants | Bosnia and Herzegovina | 38.6 /100 | #186 | Fair 2.1% |