Creek vs Guamanian/Chamorro No Schooling Completed
COMPARE
Creek
Guamanian/Chamorro
No Schooling Completed
No Schooling Completed Comparison
Creek
Guamanians/Chamorros
1.6%
NO SCHOOLING COMPLETED
99.8/ 100
METRIC RATING
53rd/ 347
METRIC RANK
2.2%
NO SCHOOLING COMPLETED
29.8/ 100
METRIC RATING
192nd/ 347
METRIC RANK
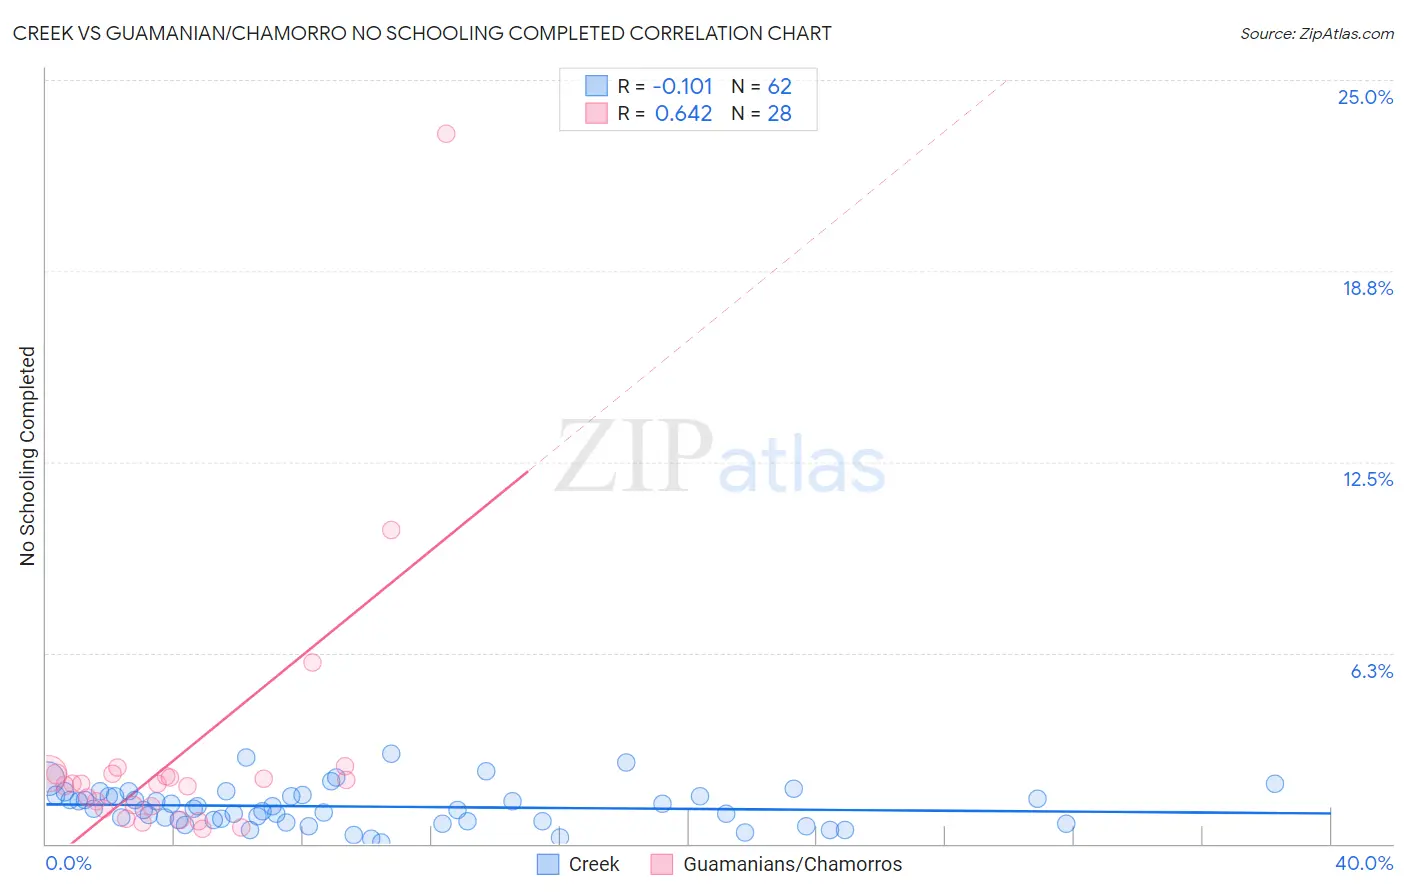
Creek vs Guamanian/Chamorro No Schooling Completed Correlation Chart
The statistical analysis conducted on geographies consisting of 177,524,954 people shows a poor negative correlation between the proportion of Creek and percentage of population with no schooling in the United States with a correlation coefficient (R) of -0.101 and weighted average of 1.6%. Similarly, the statistical analysis conducted on geographies consisting of 220,951,365 people shows a significant positive correlation between the proportion of Guamanians/Chamorros and percentage of population with no schooling in the United States with a correlation coefficient (R) of 0.642 and weighted average of 2.2%, a difference of 31.3%.
No Schooling Completed Correlation Summary
| Measurement | Creek | Guamanian/Chamorro |
| Minimum | 0.049% | 0.47% |
| Maximum | 2.9% | 23.2% |
| Range | 2.9% | 22.8% |
| Mean | 1.2% | 2.9% |
| Median | 1.1% | 2.0% |
| Interquartile 25% (IQ1) | 0.74% | 1.2% |
| Interquartile 75% (IQ3) | 1.6% | 2.3% |
| Interquartile Range (IQR) | 0.82% | 1.1% |
| Standard Deviation (Sample) | 0.64% | 4.4% |
| Standard Deviation (Population) | 0.64% | 4.3% |
Similar Demographics by No Schooling Completed
Demographics Similar to Creek by No Schooling Completed
In terms of no schooling completed, the demographic groups most similar to Creek are Crow (1.6%, a difference of 0.030%), Immigrants from Canada (1.6%, a difference of 0.13%), Greek (1.6%, a difference of 0.15%), Immigrants from North America (1.6%, a difference of 0.15%), and Chippewa (1.6%, a difference of 0.20%).
| Demographics | Rating | Rank | No Schooling Completed |
| Maltese | 99.9 /100 | #46 | Exceptional 1.6% |
| Ottawa | 99.9 /100 | #47 | Exceptional 1.6% |
| Immigrants | Scotland | 99.9 /100 | #48 | Exceptional 1.6% |
| Whites/Caucasians | 99.9 /100 | #49 | Exceptional 1.6% |
| Celtics | 99.9 /100 | #50 | Exceptional 1.6% |
| Chippewa | 99.8 /100 | #51 | Exceptional 1.6% |
| Immigrants | Canada | 99.8 /100 | #52 | Exceptional 1.6% |
| Creek | 99.8 /100 | #53 | Exceptional 1.6% |
| Crow | 99.8 /100 | #54 | Exceptional 1.6% |
| Greeks | 99.8 /100 | #55 | Exceptional 1.6% |
| Immigrants | North America | 99.8 /100 | #56 | Exceptional 1.6% |
| Austrians | 99.8 /100 | #57 | Exceptional 1.6% |
| Kiowa | 99.8 /100 | #58 | Exceptional 1.6% |
| Slavs | 99.8 /100 | #59 | Exceptional 1.7% |
| Americans | 99.8 /100 | #60 | Exceptional 1.7% |
Demographics Similar to Guamanians/Chamorros by No Schooling Completed
In terms of no schooling completed, the demographic groups most similar to Guamanians/Chamorros are Paraguayan (2.2%, a difference of 0.080%), Bermudan (2.1%, a difference of 0.14%), Immigrants from Albania (2.2%, a difference of 0.24%), Spanish American (2.1%, a difference of 0.43%), and Hawaiian (2.2%, a difference of 0.44%).
| Demographics | Rating | Rank | No Schooling Completed |
| Mongolians | 40.8 /100 | #185 | Average 2.1% |
| Immigrants | Bosnia and Herzegovina | 38.6 /100 | #186 | Fair 2.1% |
| Navajo | 36.5 /100 | #187 | Fair 2.1% |
| Immigrants | Kenya | 36.2 /100 | #188 | Fair 2.1% |
| Immigrants | Egypt | 36.1 /100 | #189 | Fair 2.1% |
| Spanish Americans | 32.6 /100 | #190 | Fair 2.1% |
| Bermudans | 30.7 /100 | #191 | Fair 2.1% |
| Guamanians/Chamorros | 29.8 /100 | #192 | Fair 2.2% |
| Paraguayans | 29.3 /100 | #193 | Fair 2.2% |
| Immigrants | Albania | 28.3 /100 | #194 | Fair 2.2% |
| Hawaiians | 27.0 /100 | #195 | Fair 2.2% |
| Immigrants | Ukraine | 26.1 /100 | #196 | Fair 2.2% |
| Immigrants | Southern Europe | 23.8 /100 | #197 | Fair 2.2% |
| Immigrants | Chile | 22.7 /100 | #198 | Fair 2.2% |
| Africans | 21.8 /100 | #199 | Fair 2.2% |