Creek vs Immigrants from Syria Disability Age 65 to 74
COMPARE
Creek
Immigrants from Syria
Disability Age 65 to 74
Disability Age 65 to 74 Comparison
Creek
Immigrants from Syria
30.2%
DISABILITY AGE 65 TO 74
0.0/ 100
METRIC RATING
330th/ 347
METRIC RANK
22.7%
DISABILITY AGE 65 TO 74
85.8/ 100
METRIC RATING
139th/ 347
METRIC RANK
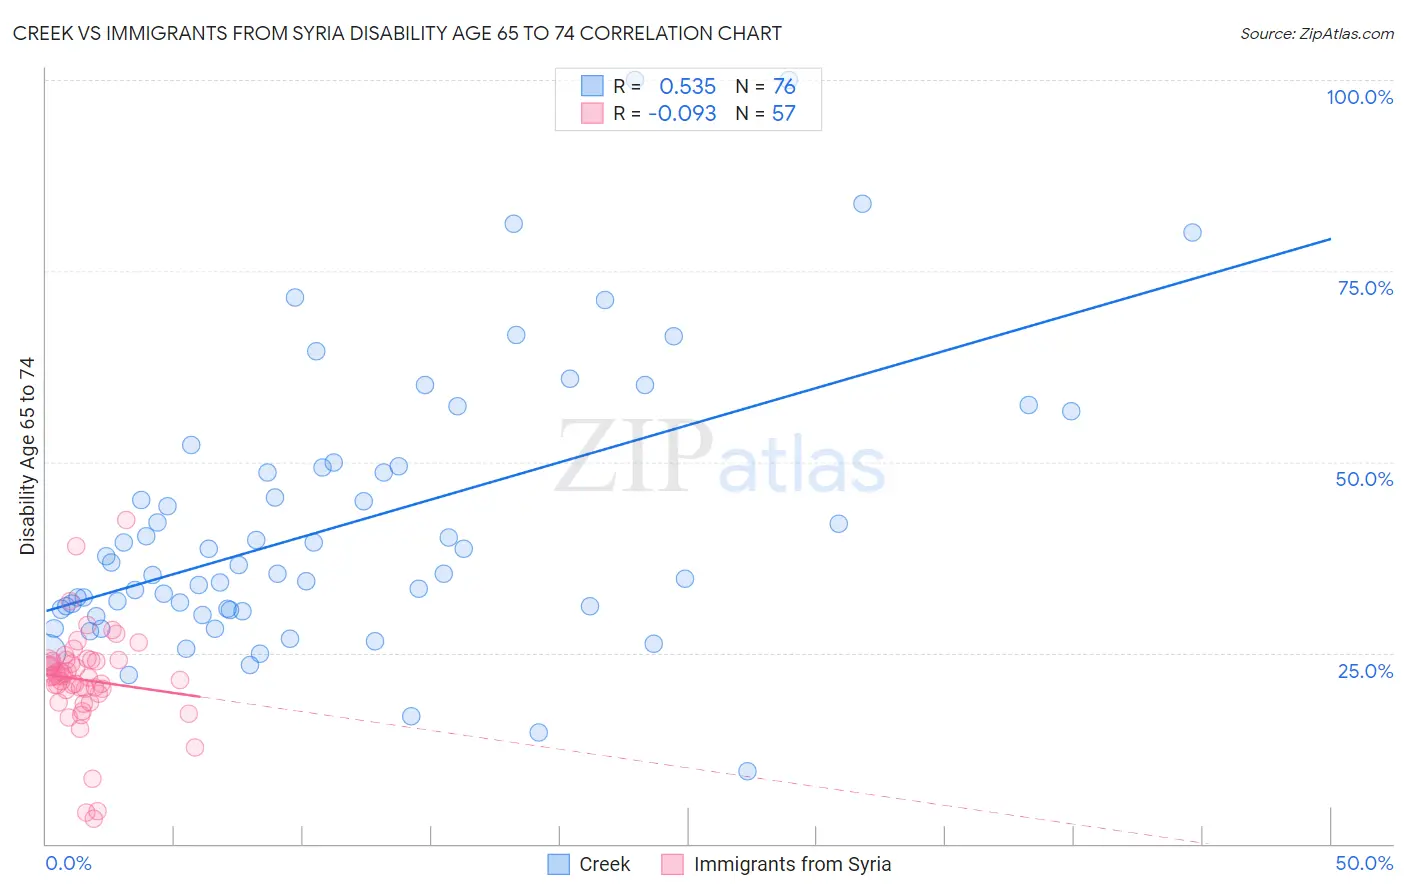
Creek vs Immigrants from Syria Disability Age 65 to 74 Correlation Chart
The statistical analysis conducted on geographies consisting of 178,280,252 people shows a substantial positive correlation between the proportion of Creek and percentage of population with a disability between the ages 65 and 75 in the United States with a correlation coefficient (R) of 0.535 and weighted average of 30.2%. Similarly, the statistical analysis conducted on geographies consisting of 174,093,430 people shows a slight negative correlation between the proportion of Immigrants from Syria and percentage of population with a disability between the ages 65 and 75 in the United States with a correlation coefficient (R) of -0.093 and weighted average of 22.7%, a difference of 32.9%.
Disability Age 65 to 74 Correlation Summary
| Measurement | Creek | Immigrants from Syria |
| Minimum | 9.4% | 3.3% |
| Maximum | 100.0% | 42.3% |
| Range | 90.6% | 39.0% |
| Mean | 41.9% | 21.5% |
| Median | 35.9% | 21.9% |
| Interquartile 25% (IQ1) | 30.7% | 19.9% |
| Interquartile 75% (IQ3) | 49.3% | 23.9% |
| Interquartile Range (IQR) | 18.6% | 4.0% |
| Standard Deviation (Sample) | 18.2% | 6.6% |
| Standard Deviation (Population) | 18.1% | 6.6% |
Similar Demographics by Disability Age 65 to 74
Demographics Similar to Creek by Disability Age 65 to 74
In terms of disability age 65 to 74, the demographic groups most similar to Creek are Chickasaw (30.2%, a difference of 0.010%), Choctaw (30.2%, a difference of 0.030%), Native/Alaskan (30.4%, a difference of 0.63%), Hopi (30.0%, a difference of 0.83%), and Colville (30.5%, a difference of 1.1%).
| Demographics | Rating | Rank | Disability Age 65 to 74 |
| Puerto Ricans | 0.0 /100 | #323 | Tragic 29.1% |
| Seminole | 0.0 /100 | #324 | Tragic 29.4% |
| Dutch West Indians | 0.0 /100 | #325 | Tragic 29.6% |
| Yakama | 0.0 /100 | #326 | Tragic 29.6% |
| Apache | 0.0 /100 | #327 | Tragic 29.7% |
| Hopi | 0.0 /100 | #328 | Tragic 30.0% |
| Choctaw | 0.0 /100 | #329 | Tragic 30.2% |
| Creek | 0.0 /100 | #330 | Tragic 30.2% |
| Chickasaw | 0.0 /100 | #331 | Tragic 30.2% |
| Natives/Alaskans | 0.0 /100 | #332 | Tragic 30.4% |
| Colville | 0.0 /100 | #333 | Tragic 30.5% |
| Alaska Natives | 0.0 /100 | #334 | Tragic 30.6% |
| Cheyenne | 0.0 /100 | #335 | Tragic 31.1% |
| Yuman | 0.0 /100 | #336 | Tragic 31.5% |
| Houma | 0.0 /100 | #337 | Tragic 32.3% |
Demographics Similar to Immigrants from Syria by Disability Age 65 to 74
In terms of disability age 65 to 74, the demographic groups most similar to Immigrants from Syria are Ugandan (22.7%, a difference of 0.040%), Belgian (22.7%, a difference of 0.050%), Immigrants from Ethiopia (22.7%, a difference of 0.060%), Arab (22.8%, a difference of 0.12%), and Danish (22.8%, a difference of 0.17%).
| Demographics | Rating | Rank | Disability Age 65 to 74 |
| Costa Ricans | 89.2 /100 | #132 | Excellent 22.6% |
| Northern Europeans | 88.9 /100 | #133 | Excellent 22.6% |
| Afghans | 88.6 /100 | #134 | Excellent 22.6% |
| Immigrants | Ukraine | 88.4 /100 | #135 | Excellent 22.6% |
| Ethiopians | 87.9 /100 | #136 | Excellent 22.7% |
| Taiwanese | 87.6 /100 | #137 | Excellent 22.7% |
| Immigrants | Moldova | 87.3 /100 | #138 | Excellent 22.7% |
| Immigrants | Syria | 85.8 /100 | #139 | Excellent 22.7% |
| Ugandans | 85.4 /100 | #140 | Excellent 22.7% |
| Belgians | 85.3 /100 | #141 | Excellent 22.7% |
| Immigrants | Ethiopia | 85.3 /100 | #142 | Excellent 22.7% |
| Arabs | 84.8 /100 | #143 | Excellent 22.8% |
| Danes | 84.4 /100 | #144 | Excellent 22.8% |
| Immigrants | Uganda | 84.0 /100 | #145 | Excellent 22.8% |
| Alsatians | 83.7 /100 | #146 | Excellent 22.8% |