Nonimmigrants vs Immigrants from South America Master's Degree
COMPARE
Nonimmigrants
Immigrants from South America
Master's Degree
Master's Degree Comparison
Nonimmigrants
Immigrants from South America
13.3%
MASTER'S DEGREE
3.4/ 100
METRIC RATING
239th/ 347
METRIC RANK
15.5%
MASTER'S DEGREE
76.3/ 100
METRIC RATING
154th/ 347
METRIC RANK
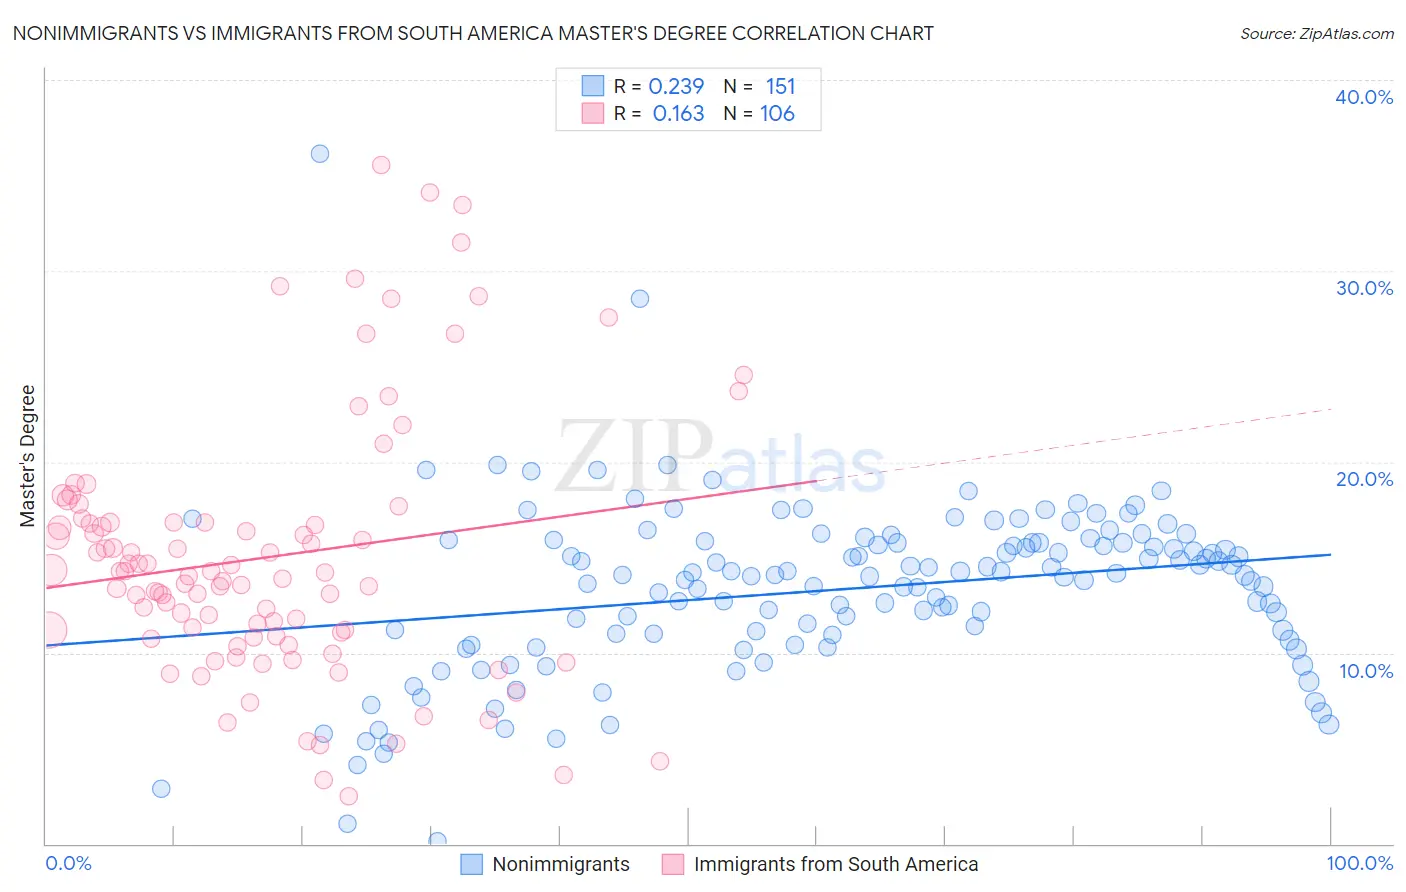
Nonimmigrants vs Immigrants from South America Master's Degree Correlation Chart
The statistical analysis conducted on geographies consisting of 583,073,309 people shows a weak positive correlation between the proportion of Nonimmigrants and percentage of population with at least master's degree education in the United States with a correlation coefficient (R) of 0.239 and weighted average of 13.3%. Similarly, the statistical analysis conducted on geographies consisting of 486,157,509 people shows a poor positive correlation between the proportion of Immigrants from South America and percentage of population with at least master's degree education in the United States with a correlation coefficient (R) of 0.163 and weighted average of 15.5%, a difference of 16.1%.
Master's Degree Correlation Summary
| Measurement | Nonimmigrants | Immigrants from South America |
| Minimum | 0.15% | 2.5% |
| Maximum | 36.1% | 35.5% |
| Range | 36.0% | 33.0% |
| Mean | 13.3% | 15.0% |
| Median | 14.1% | 14.1% |
| Interquartile 25% (IQ1) | 11.0% | 10.9% |
| Interquartile 75% (IQ3) | 15.8% | 16.8% |
| Interquartile Range (IQR) | 4.8% | 5.9% |
| Standard Deviation (Sample) | 4.5% | 6.8% |
| Standard Deviation (Population) | 4.5% | 6.8% |
Similar Demographics by Master's Degree
Demographics Similar to Nonimmigrants by Master's Degree
In terms of master's degree, the demographic groups most similar to Nonimmigrants are Hmong (13.4%, a difference of 0.53%), Jamaican (13.4%, a difference of 0.67%), Immigrants from Guyana (13.4%, a difference of 0.89%), German Russian (13.5%, a difference of 1.0%), and Immigrants from Burma/Myanmar (13.5%, a difference of 1.4%).
| Demographics | Rating | Rank | Master's Degree |
| Immigrants | Philippines | 6.0 /100 | #232 | Tragic 13.6% |
| Immigrants | Ecuador | 5.7 /100 | #233 | Tragic 13.6% |
| Immigrants | Burma/Myanmar | 5.0 /100 | #234 | Tragic 13.5% |
| German Russians | 4.5 /100 | #235 | Tragic 13.5% |
| Immigrants | Guyana | 4.4 /100 | #236 | Tragic 13.4% |
| Jamaicans | 4.1 /100 | #237 | Tragic 13.4% |
| Hmong | 4.0 /100 | #238 | Tragic 13.4% |
| Immigrants | Nonimmigrants | 3.4 /100 | #239 | Tragic 13.3% |
| Guamanians/Chamorros | 2.2 /100 | #240 | Tragic 13.1% |
| U.S. Virgin Islanders | 2.1 /100 | #241 | Tragic 13.1% |
| Spanish Americans | 1.9 /100 | #242 | Tragic 13.0% |
| Immigrants | Jamaica | 1.9 /100 | #243 | Tragic 13.0% |
| Delaware | 1.7 /100 | #244 | Tragic 13.0% |
| Immigrants | Bahamas | 1.4 /100 | #245 | Tragic 12.9% |
| Immigrants | Cambodia | 1.4 /100 | #246 | Tragic 12.9% |
Demographics Similar to Immigrants from South America by Master's Degree
In terms of master's degree, the demographic groups most similar to Immigrants from South America are Immigrants from Bangladesh (15.5%, a difference of 0.040%), Icelander (15.5%, a difference of 0.090%), Slavic (15.5%, a difference of 0.12%), Iraqi (15.5%, a difference of 0.17%), and Slovene (15.5%, a difference of 0.29%).
| Demographics | Rating | Rank | Master's Degree |
| Hungarians | 79.1 /100 | #147 | Good 15.6% |
| Immigrants | Senegal | 78.2 /100 | #148 | Good 15.5% |
| Ghanaians | 78.2 /100 | #149 | Good 15.5% |
| Slovenes | 78.0 /100 | #150 | Good 15.5% |
| Iraqis | 77.3 /100 | #151 | Good 15.5% |
| Slavs | 77.0 /100 | #152 | Good 15.5% |
| Icelanders | 76.8 /100 | #153 | Good 15.5% |
| Immigrants | South America | 76.3 /100 | #154 | Good 15.5% |
| Immigrants | Bangladesh | 76.1 /100 | #155 | Good 15.5% |
| Bermudans | 73.9 /100 | #156 | Good 15.4% |
| Immigrants | Cameroon | 71.7 /100 | #157 | Good 15.4% |
| Immigrants | Poland | 71.5 /100 | #158 | Good 15.4% |
| Luxembourgers | 71.0 /100 | #159 | Good 15.3% |
| Kenyans | 70.3 /100 | #160 | Good 15.3% |
| Sudanese | 68.7 /100 | #161 | Good 15.3% |