Cree vs Immigrants from South America Disability Age 65 to 74
COMPARE
Cree
Immigrants from South America
Disability Age 65 to 74
Disability Age 65 to 74 Comparison
Cree
Immigrants from South America
25.9%
DISABILITY AGE 65 TO 74
0.1/ 100
METRIC RATING
280th/ 347
METRIC RANK
22.3%
DISABILITY AGE 65 TO 74
95.5/ 100
METRIC RATING
112th/ 347
METRIC RANK
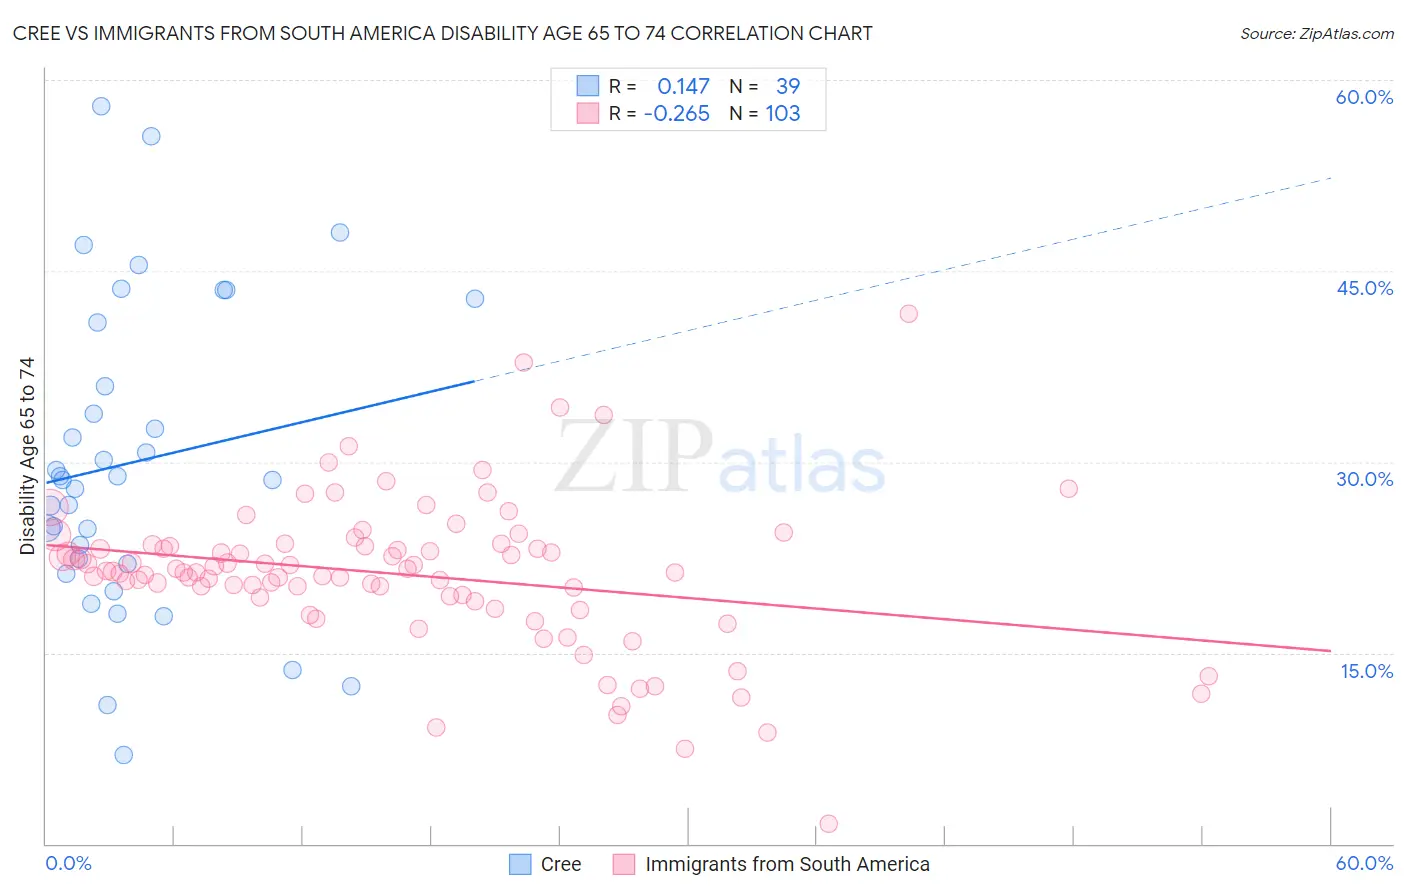
Cree vs Immigrants from South America Disability Age 65 to 74 Correlation Chart
The statistical analysis conducted on geographies consisting of 76,196,128 people shows a poor positive correlation between the proportion of Cree and percentage of population with a disability between the ages 65 and 75 in the United States with a correlation coefficient (R) of 0.147 and weighted average of 25.9%. Similarly, the statistical analysis conducted on geographies consisting of 485,069,818 people shows a weak negative correlation between the proportion of Immigrants from South America and percentage of population with a disability between the ages 65 and 75 in the United States with a correlation coefficient (R) of -0.265 and weighted average of 22.3%, a difference of 16.1%.
Disability Age 65 to 74 Correlation Summary
| Measurement | Cree | Immigrants from South America |
| Minimum | 7.0% | 1.6% |
| Maximum | 57.9% | 41.7% |
| Range | 50.9% | 40.1% |
| Mean | 30.0% | 21.2% |
| Median | 28.6% | 21.4% |
| Interquartile 25% (IQ1) | 22.0% | 19.3% |
| Interquartile 75% (IQ3) | 40.9% | 23.4% |
| Interquartile Range (IQR) | 18.9% | 4.1% |
| Standard Deviation (Sample) | 12.1% | 5.9% |
| Standard Deviation (Population) | 11.9% | 5.9% |
Similar Demographics by Disability Age 65 to 74
Demographics Similar to Cree by Disability Age 65 to 74
In terms of disability age 65 to 74, the demographic groups most similar to Cree are Immigrants from Honduras (25.9%, a difference of 0.020%), U.S. Virgin Islander (25.9%, a difference of 0.080%), Delaware (25.9%, a difference of 0.090%), Immigrants from Belize (25.8%, a difference of 0.16%), and Belizean (25.8%, a difference of 0.18%).
| Demographics | Rating | Rank | Disability Age 65 to 74 |
| Japanese | 0.1 /100 | #273 | Tragic 25.7% |
| Americans | 0.1 /100 | #274 | Tragic 25.8% |
| Hondurans | 0.1 /100 | #275 | Tragic 25.8% |
| French American Indians | 0.1 /100 | #276 | Tragic 25.8% |
| Belizeans | 0.1 /100 | #277 | Tragic 25.8% |
| Immigrants | Belize | 0.1 /100 | #278 | Tragic 25.8% |
| U.S. Virgin Islanders | 0.1 /100 | #279 | Tragic 25.9% |
| Cree | 0.1 /100 | #280 | Tragic 25.9% |
| Immigrants | Honduras | 0.1 /100 | #281 | Tragic 25.9% |
| Delaware | 0.1 /100 | #282 | Tragic 25.9% |
| Spanish Americans | 0.0 /100 | #283 | Tragic 25.9% |
| Immigrants | Azores | 0.0 /100 | #284 | Tragic 26.0% |
| Immigrants | Congo | 0.0 /100 | #285 | Tragic 26.0% |
| Immigrants | Micronesia | 0.0 /100 | #286 | Tragic 26.1% |
| Immigrants | Laos | 0.0 /100 | #287 | Tragic 26.1% |
Demographics Similar to Immigrants from South America by Disability Age 65 to 74
In terms of disability age 65 to 74, the demographic groups most similar to Immigrants from South America are Syrian (22.3%, a difference of 0.050%), Serbian (22.3%, a difference of 0.060%), Immigrants from Peru (22.3%, a difference of 0.080%), Albanian (22.3%, a difference of 0.13%), and Ukrainian (22.3%, a difference of 0.14%).
| Demographics | Rating | Rank | Disability Age 65 to 74 |
| Palestinians | 96.3 /100 | #105 | Exceptional 22.2% |
| Peruvians | 96.1 /100 | #106 | Exceptional 22.2% |
| Slovenes | 96.1 /100 | #107 | Exceptional 22.2% |
| Immigrants | Zimbabwe | 96.1 /100 | #108 | Exceptional 22.3% |
| Albanians | 95.8 /100 | #109 | Exceptional 22.3% |
| Immigrants | Peru | 95.7 /100 | #110 | Exceptional 22.3% |
| Serbians | 95.7 /100 | #111 | Exceptional 22.3% |
| Immigrants | South America | 95.5 /100 | #112 | Exceptional 22.3% |
| Syrians | 95.3 /100 | #113 | Exceptional 22.3% |
| Ukrainians | 95.1 /100 | #114 | Exceptional 22.3% |
| Laotians | 94.9 /100 | #115 | Exceptional 22.3% |
| Brazilians | 94.8 /100 | #116 | Exceptional 22.4% |
| Swedes | 94.7 /100 | #117 | Exceptional 22.4% |
| Austrians | 94.7 /100 | #118 | Exceptional 22.4% |
| Immigrants | Northern Africa | 94.7 /100 | #119 | Exceptional 22.4% |