Cree vs Immigrants from South America Single Father Households
COMPARE
Cree
Immigrants from South America
Single Father Households
Single Father Households Comparison
Cree
Immigrants from South America
2.8%
SINGLE FATHER HOUSEHOLDS
0.0/ 100
METRIC RATING
298th/ 347
METRIC RANK
2.3%
SINGLE FATHER HOUSEHOLDS
79.9/ 100
METRIC RATING
156th/ 347
METRIC RANK
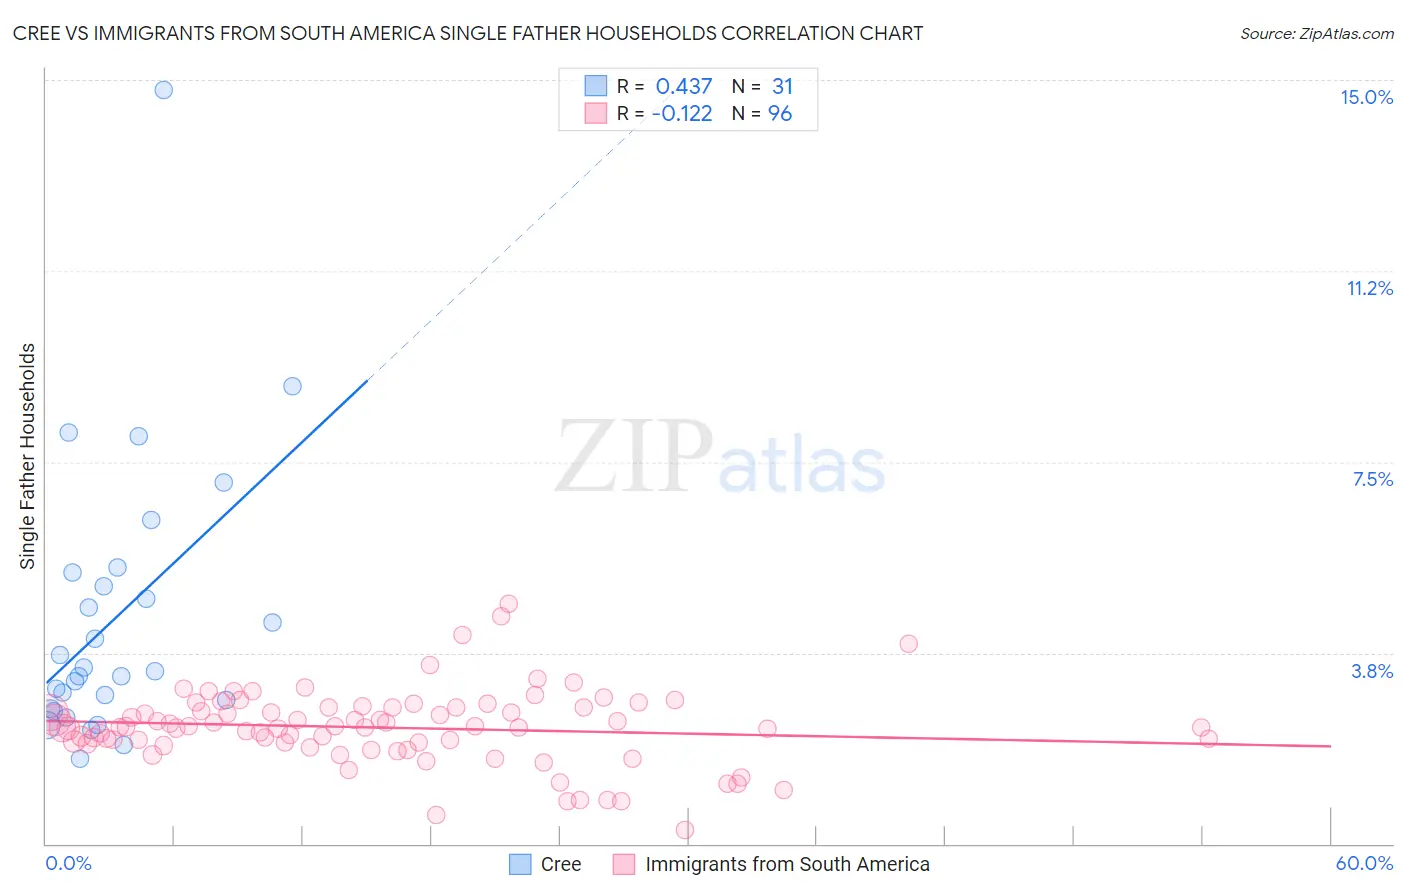
Cree vs Immigrants from South America Single Father Households Correlation Chart
The statistical analysis conducted on geographies consisting of 76,112,534 people shows a moderate positive correlation between the proportion of Cree and percentage of single father households in the United States with a correlation coefficient (R) of 0.437 and weighted average of 2.8%. Similarly, the statistical analysis conducted on geographies consisting of 479,744,076 people shows a poor negative correlation between the proportion of Immigrants from South America and percentage of single father households in the United States with a correlation coefficient (R) of -0.122 and weighted average of 2.3%, a difference of 21.5%.
Single Father Households Correlation Summary
| Measurement | Cree | Immigrants from South America |
| Minimum | 1.7% | 0.26% |
| Maximum | 14.8% | 4.7% |
| Range | 13.1% | 4.5% |
| Mean | 4.4% | 2.3% |
| Median | 3.4% | 2.3% |
| Interquartile 25% (IQ1) | 2.7% | 2.0% |
| Interquartile 75% (IQ3) | 5.3% | 2.7% |
| Interquartile Range (IQR) | 2.7% | 0.71% |
| Standard Deviation (Sample) | 2.7% | 0.75% |
| Standard Deviation (Population) | 2.7% | 0.74% |
Similar Demographics by Single Father Households
Demographics Similar to Cree by Single Father Households
In terms of single father households, the demographic groups most similar to Cree are Lumbee (2.8%, a difference of 0.38%), Honduran (2.8%, a difference of 0.49%), Japanese (2.8%, a difference of 0.57%), Chickasaw (2.8%, a difference of 0.59%), and Kiowa (2.8%, a difference of 0.77%).
| Demographics | Rating | Rank | Single Father Households |
| Blackfeet | 0.0 /100 | #291 | Tragic 2.7% |
| Choctaw | 0.0 /100 | #292 | Tragic 2.7% |
| Immigrants | Fiji | 0.0 /100 | #293 | Tragic 2.7% |
| Malaysians | 0.0 /100 | #294 | Tragic 2.7% |
| Chickasaw | 0.0 /100 | #295 | Tragic 2.8% |
| Japanese | 0.0 /100 | #296 | Tragic 2.8% |
| Hondurans | 0.0 /100 | #297 | Tragic 2.8% |
| Cree | 0.0 /100 | #298 | Tragic 2.8% |
| Lumbee | 0.0 /100 | #299 | Tragic 2.8% |
| Kiowa | 0.0 /100 | #300 | Tragic 2.8% |
| Immigrants | Latin America | 0.0 /100 | #301 | Tragic 2.8% |
| Spanish Americans | 0.0 /100 | #302 | Tragic 2.8% |
| Immigrants | Honduras | 0.0 /100 | #303 | Tragic 2.8% |
| Mexican American Indians | 0.0 /100 | #304 | Tragic 2.8% |
| Hispanics or Latinos | 0.0 /100 | #305 | Tragic 2.8% |
Demographics Similar to Immigrants from South America by Single Father Households
In terms of single father households, the demographic groups most similar to Immigrants from South America are Canadian (2.3%, a difference of 0.020%), Immigrants from Senegal (2.3%, a difference of 0.050%), European (2.3%, a difference of 0.12%), Bolivian (2.3%, a difference of 0.14%), and Immigrants from West Indies (2.3%, a difference of 0.22%).
| Demographics | Rating | Rank | Single Father Households |
| Senegalese | 88.4 /100 | #149 | Excellent 2.3% |
| Venezuelans | 86.2 /100 | #150 | Excellent 2.3% |
| Immigrants | Syria | 84.8 /100 | #151 | Excellent 2.3% |
| Immigrants | Venezuela | 83.2 /100 | #152 | Excellent 2.3% |
| Immigrants | Germany | 82.8 /100 | #153 | Excellent 2.3% |
| Bolivians | 81.0 /100 | #154 | Excellent 2.3% |
| Europeans | 80.9 /100 | #155 | Excellent 2.3% |
| Immigrants | South America | 79.9 /100 | #156 | Good 2.3% |
| Canadians | 79.7 /100 | #157 | Good 2.3% |
| Immigrants | Senegal | 79.4 /100 | #158 | Good 2.3% |
| Immigrants | West Indies | 77.9 /100 | #159 | Good 2.3% |
| Immigrants | Bolivia | 76.3 /100 | #160 | Good 2.3% |
| Swiss | 73.2 /100 | #161 | Good 2.3% |
| Scottish | 72.8 /100 | #162 | Good 2.3% |
| Irish | 72.1 /100 | #163 | Good 2.3% |