Potawatomi vs Immigrants from Colombia Professional Degree
COMPARE
Potawatomi
Immigrants from Colombia
Professional Degree
Professional Degree Comparison
Potawatomi
Immigrants from Colombia
3.6%
PROFESSIONAL DEGREE
0.5/ 100
METRIC RATING
274th/ 347
METRIC RANK
4.5%
PROFESSIONAL DEGREE
59.4/ 100
METRIC RATING
166th/ 347
METRIC RANK
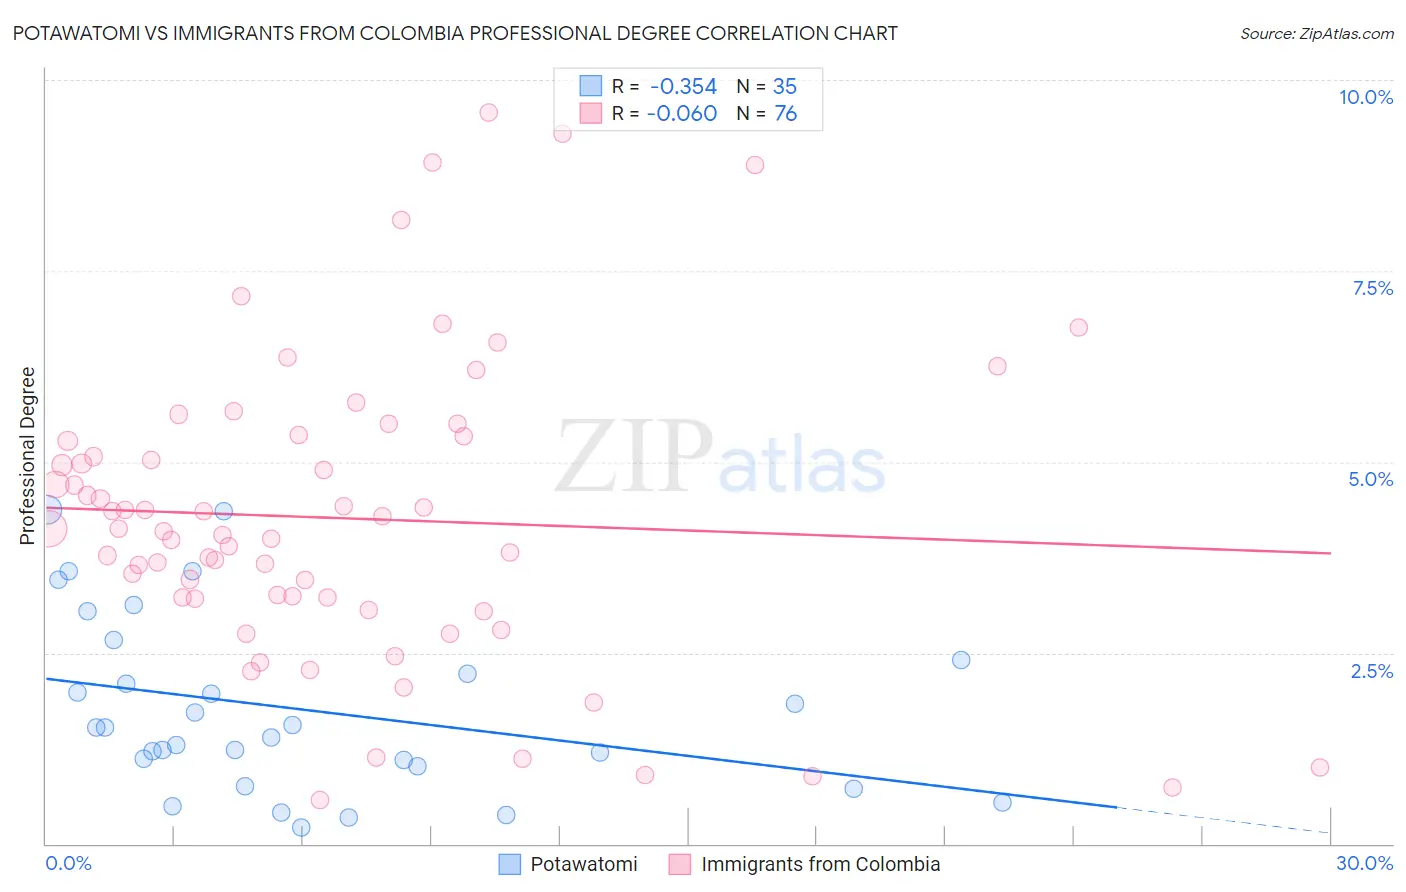
Potawatomi vs Immigrants from Colombia Professional Degree Correlation Chart
The statistical analysis conducted on geographies consisting of 117,535,348 people shows a mild negative correlation between the proportion of Potawatomi and percentage of population with at least professional degree education in the United States with a correlation coefficient (R) of -0.354 and weighted average of 3.6%. Similarly, the statistical analysis conducted on geographies consisting of 378,013,627 people shows a slight negative correlation between the proportion of Immigrants from Colombia and percentage of population with at least professional degree education in the United States with a correlation coefficient (R) of -0.060 and weighted average of 4.5%, a difference of 25.5%.
Professional Degree Correlation Summary
| Measurement | Potawatomi | Immigrants from Colombia |
| Minimum | 0.21% | 0.57% |
| Maximum | 4.4% | 9.6% |
| Range | 4.2% | 9.0% |
| Mean | 1.8% | 4.3% |
| Median | 1.5% | 4.1% |
| Interquartile 25% (IQ1) | 1.0% | 3.2% |
| Interquartile 75% (IQ3) | 2.4% | 5.3% |
| Interquartile Range (IQR) | 1.4% | 2.1% |
| Standard Deviation (Sample) | 1.1% | 2.0% |
| Standard Deviation (Population) | 1.1% | 2.0% |
Similar Demographics by Professional Degree
Demographics Similar to Potawatomi by Professional Degree
In terms of professional degree, the demographic groups most similar to Potawatomi are American (3.6%, a difference of 0.13%), Immigrants from Jamaica (3.6%, a difference of 0.19%), Belizean (3.6%, a difference of 0.22%), Immigrants from Dominica (3.6%, a difference of 0.23%), and Liberian (3.6%, a difference of 0.27%).
| Demographics | Rating | Rank | Professional Degree |
| Delaware | 0.7 /100 | #267 | Tragic 3.6% |
| Aleuts | 0.7 /100 | #268 | Tragic 3.6% |
| Immigrants | Cuba | 0.6 /100 | #269 | Tragic 3.6% |
| Central Americans | 0.6 /100 | #270 | Tragic 3.6% |
| Belizeans | 0.5 /100 | #271 | Tragic 3.6% |
| Immigrants | Jamaica | 0.5 /100 | #272 | Tragic 3.6% |
| Americans | 0.5 /100 | #273 | Tragic 3.6% |
| Potawatomi | 0.5 /100 | #274 | Tragic 3.6% |
| Immigrants | Dominica | 0.5 /100 | #275 | Tragic 3.6% |
| Liberians | 0.5 /100 | #276 | Tragic 3.6% |
| Cheyenne | 0.5 /100 | #277 | Tragic 3.6% |
| Japanese | 0.5 /100 | #278 | Tragic 3.5% |
| Immigrants | Portugal | 0.5 /100 | #279 | Tragic 3.5% |
| Dominicans | 0.5 /100 | #280 | Tragic 3.5% |
| Apache | 0.5 /100 | #281 | Tragic 3.5% |
Demographics Similar to Immigrants from Colombia by Professional Degree
In terms of professional degree, the demographic groups most similar to Immigrants from Colombia are Immigrants from Afghanistan (4.5%, a difference of 0.030%), Costa Rican (4.5%, a difference of 0.080%), Immigrants from Sierra Leone (4.5%, a difference of 0.10%), Chinese (4.5%, a difference of 0.11%), and Swiss (4.5%, a difference of 0.24%).
| Demographics | Rating | Rank | Professional Degree |
| Vietnamese | 68.4 /100 | #159 | Good 4.5% |
| Immigrants | Senegal | 68.0 /100 | #160 | Good 4.5% |
| Assyrians/Chaldeans/Syriacs | 67.4 /100 | #161 | Good 4.5% |
| Peruvians | 65.2 /100 | #162 | Good 4.5% |
| Sierra Leoneans | 64.3 /100 | #163 | Good 4.5% |
| Swiss | 61.0 /100 | #164 | Good 4.5% |
| Costa Ricans | 59.9 /100 | #165 | Average 4.5% |
| Immigrants | Colombia | 59.4 /100 | #166 | Average 4.5% |
| Immigrants | Afghanistan | 59.2 /100 | #167 | Average 4.5% |
| Immigrants | Sierra Leone | 58.7 /100 | #168 | Average 4.5% |
| Chinese | 58.6 /100 | #169 | Average 4.5% |
| Immigrants | Zaire | 57.4 /100 | #170 | Average 4.5% |
| Immigrants | Bangladesh | 56.0 /100 | #171 | Average 4.4% |
| Spaniards | 52.0 /100 | #172 | Average 4.4% |
| English | 50.1 /100 | #173 | Average 4.4% |