Immigrants from Yemen vs Immigrants from Colombia Professional Degree
COMPARE
Immigrants from Yemen
Immigrants from Colombia
Professional Degree
Professional Degree Comparison
Immigrants from Yemen
Immigrants from Colombia
3.4%
PROFESSIONAL DEGREE
0.2/ 100
METRIC RATING
299th/ 347
METRIC RANK
4.5%
PROFESSIONAL DEGREE
59.4/ 100
METRIC RATING
166th/ 347
METRIC RANK
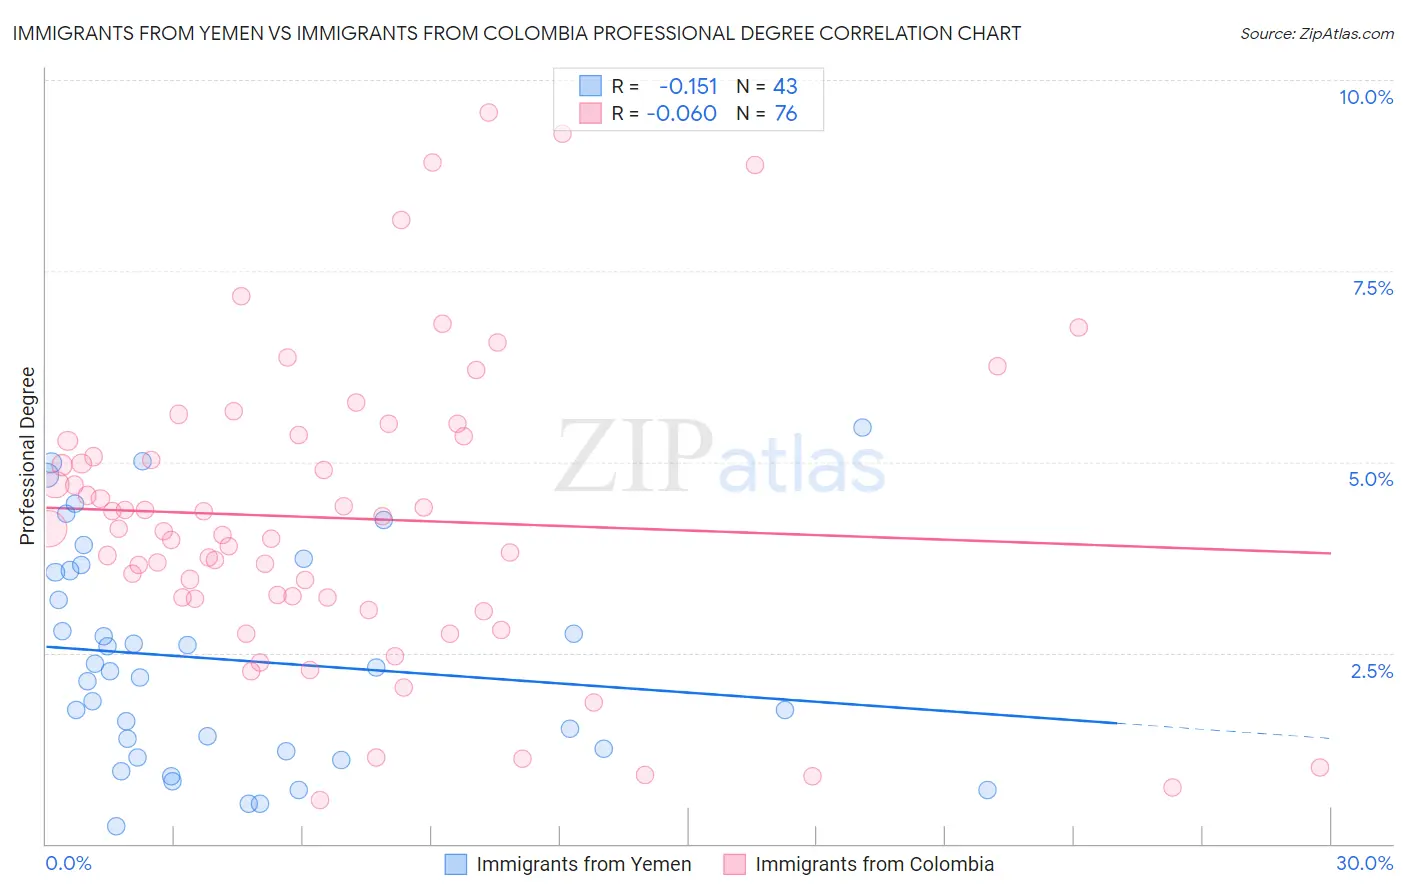
Immigrants from Yemen vs Immigrants from Colombia Professional Degree Correlation Chart
The statistical analysis conducted on geographies consisting of 82,369,214 people shows a poor negative correlation between the proportion of Immigrants from Yemen and percentage of population with at least professional degree education in the United States with a correlation coefficient (R) of -0.151 and weighted average of 3.4%. Similarly, the statistical analysis conducted on geographies consisting of 378,013,627 people shows a slight negative correlation between the proportion of Immigrants from Colombia and percentage of population with at least professional degree education in the United States with a correlation coefficient (R) of -0.060 and weighted average of 4.5%, a difference of 31.1%.
Professional Degree Correlation Summary
| Measurement | Immigrants from Yemen | Immigrants from Colombia |
| Minimum | 0.23% | 0.57% |
| Maximum | 5.4% | 9.6% |
| Range | 5.2% | 9.0% |
| Mean | 2.4% | 4.3% |
| Median | 2.3% | 4.1% |
| Interquartile 25% (IQ1) | 1.2% | 3.2% |
| Interquartile 75% (IQ3) | 3.6% | 5.3% |
| Interquartile Range (IQR) | 2.4% | 2.1% |
| Standard Deviation (Sample) | 1.4% | 2.0% |
| Standard Deviation (Population) | 1.4% | 2.0% |
Similar Demographics by Professional Degree
Demographics Similar to Immigrants from Yemen by Professional Degree
In terms of professional degree, the demographic groups most similar to Immigrants from Yemen are Black/African American (3.4%, a difference of 0.13%), Immigrants from Dominican Republic (3.4%, a difference of 0.28%), Malaysian (3.4%, a difference of 0.38%), Ottawa (3.4%, a difference of 0.67%), and Immigrants from Liberia (3.4%, a difference of 0.72%).
| Demographics | Rating | Rank | Professional Degree |
| Immigrants | Belize | 0.3 /100 | #292 | Tragic 3.5% |
| Immigrants | Honduras | 0.3 /100 | #293 | Tragic 3.5% |
| Paiute | 0.3 /100 | #294 | Tragic 3.4% |
| Immigrants | Guatemala | 0.2 /100 | #295 | Tragic 3.4% |
| Hawaiians | 0.2 /100 | #296 | Tragic 3.4% |
| Immigrants | Liberia | 0.2 /100 | #297 | Tragic 3.4% |
| Ottawa | 0.2 /100 | #298 | Tragic 3.4% |
| Immigrants | Yemen | 0.2 /100 | #299 | Tragic 3.4% |
| Blacks/African Americans | 0.2 /100 | #300 | Tragic 3.4% |
| Immigrants | Dominican Republic | 0.2 /100 | #301 | Tragic 3.4% |
| Malaysians | 0.2 /100 | #302 | Tragic 3.4% |
| Immigrants | Haiti | 0.2 /100 | #303 | Tragic 3.4% |
| Cajuns | 0.2 /100 | #304 | Tragic 3.4% |
| Chickasaw | 0.1 /100 | #305 | Tragic 3.4% |
| Cape Verdeans | 0.1 /100 | #306 | Tragic 3.4% |
Demographics Similar to Immigrants from Colombia by Professional Degree
In terms of professional degree, the demographic groups most similar to Immigrants from Colombia are Immigrants from Afghanistan (4.5%, a difference of 0.030%), Costa Rican (4.5%, a difference of 0.080%), Immigrants from Sierra Leone (4.5%, a difference of 0.10%), Chinese (4.5%, a difference of 0.11%), and Swiss (4.5%, a difference of 0.24%).
| Demographics | Rating | Rank | Professional Degree |
| Vietnamese | 68.4 /100 | #159 | Good 4.5% |
| Immigrants | Senegal | 68.0 /100 | #160 | Good 4.5% |
| Assyrians/Chaldeans/Syriacs | 67.4 /100 | #161 | Good 4.5% |
| Peruvians | 65.2 /100 | #162 | Good 4.5% |
| Sierra Leoneans | 64.3 /100 | #163 | Good 4.5% |
| Swiss | 61.0 /100 | #164 | Good 4.5% |
| Costa Ricans | 59.9 /100 | #165 | Average 4.5% |
| Immigrants | Colombia | 59.4 /100 | #166 | Average 4.5% |
| Immigrants | Afghanistan | 59.2 /100 | #167 | Average 4.5% |
| Immigrants | Sierra Leone | 58.7 /100 | #168 | Average 4.5% |
| Chinese | 58.6 /100 | #169 | Average 4.5% |
| Immigrants | Zaire | 57.4 /100 | #170 | Average 4.5% |
| Immigrants | Bangladesh | 56.0 /100 | #171 | Average 4.4% |
| Spaniards | 52.0 /100 | #172 | Average 4.4% |
| English | 50.1 /100 | #173 | Average 4.4% |